Gold Stocks Break Down below 2017 and 2018 Lows! / Commodities / Gold and Silver Stocks 2018

 TheHUI Index just closed below both 2017 and 2018 lows. The interpretations ofmany developments in the market are vague and subjective. But not majorbreakdowns. Gold miners just showed exceptional weakness by closing at new lowseven though gold is still above $1,300 and the S&P corrected more than halfof its recent sharp decline. Can anything save the precious metals sector fromfalling further?
Yes,but based on what happened yesterday, it seems that the golden Superman mayhave some trouble getting into the scene.
Anotherdownturn in the USD Index would likely trigger a corrective upswing in gold andsilver, which would in turn cause the prices of mining stocks to move higher.The “problem” here is that the USD has just invalidated the breakdown below thedeclining medium-term support line, which significantly lowered the odds foranother short-term decline.
Let’stake a closer look at what happened, starting with the forexaction (charts courtesy of http://stockcharts.com).
No MoreMegaphones for the USD
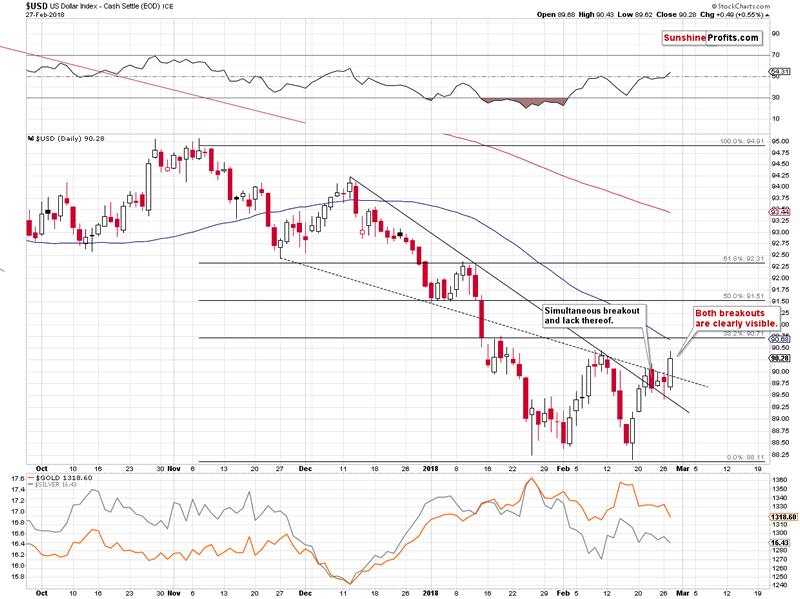
Fromthe short-term point of view, it’s clear that the USD Index has broken aboveboth declining short-term resistance lines. It hasn’t broken above the previousFebruary high, but the implications of breakouts above the declining lines arealready significantly bullish as they were two of the things that stopped therally about 3 weeks ago.
Thethird – and most important – thing that stopped the previous attempt to movehigher was the long-term declining resistance line based on the 2015 and 2016lows. Both are important, so the line based on them is also important.
Ifa line is important, then a breakdown below it is also important, and theinvalidation of the breakdown can be even more important. That’s what we sawduring yesterday’s trading – the USD rallied above the mentioned resistanceline, thus invalidating the previous breakdown.
Theimplications are already bearish, but they will be much more bearish when wealso see a breakout above the previous February high and at least two weeklycloses above it. Since the previous move above this line was followed by newlows in the USD (in the following week), we are still a bit skeptical towardyesterday’s move. Still, overall, it was a bullish development and based on theshort-term breakouts that we discussed earlier, this invalidation has a muchbigger chance of being a true one.
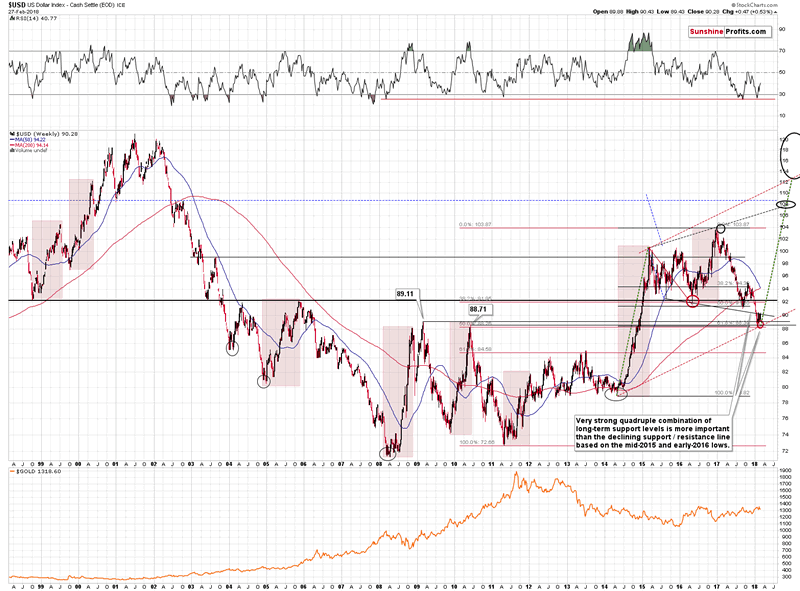
Onthe long-term chart you can see why we were very skeptical toward the possiblelong-term bearish implications of the previous breakdown below the mentioneddeclining support line. It’s because a much moreimportant support was reached, and it held. Precisely, therewas only a tiny breakdown below the combination of support levels and it wasinvalidated immediately.
Thekey mentioned support levels that held are the 2009 and 2010 tops along with 2major retracements based on major extremes (marked with red and black on theabove chart). The above combination is much stronger than the previouslydiscussed declining line. The reason is that the mid-2015 and 2016 lows areless prominent than the 2009 and 2010 tops and the line based on the former isnot strengthened by key Fibonacci retracements, while the latter is.
Consequently,the invalidation of breakdowns below the key, long-term support levels is farmore important than the declining shorter-term line.
Theabove has been the reason for one to expect the move back above the decliningresistance line. Yesterday’s session proved that the above expectation wascorrect. Moreover, thanks to the simultaneous breakout above the decliningshort-term resistance lines, the odds are that rallies will follow.
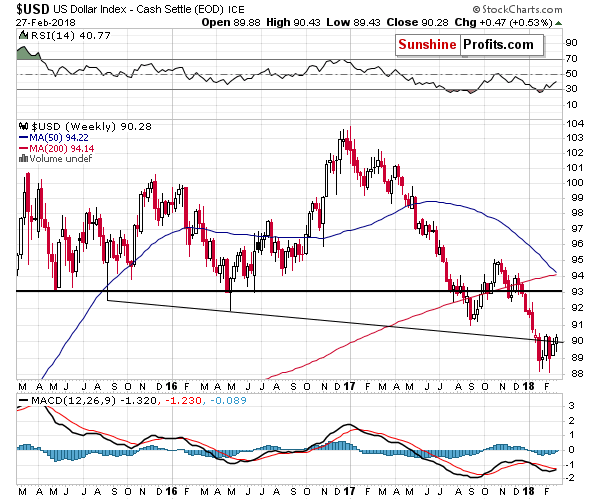
Also,the above chart explains the title of this section. The mentioned decliningresistance line based on the 2015 and 2016 lows, along with the rising dashedline based on the 2015 and 2017 tops create an expanding triangle pattern thatis sometimes referred to as a megaphone pattern.
TheGolden Breakdown
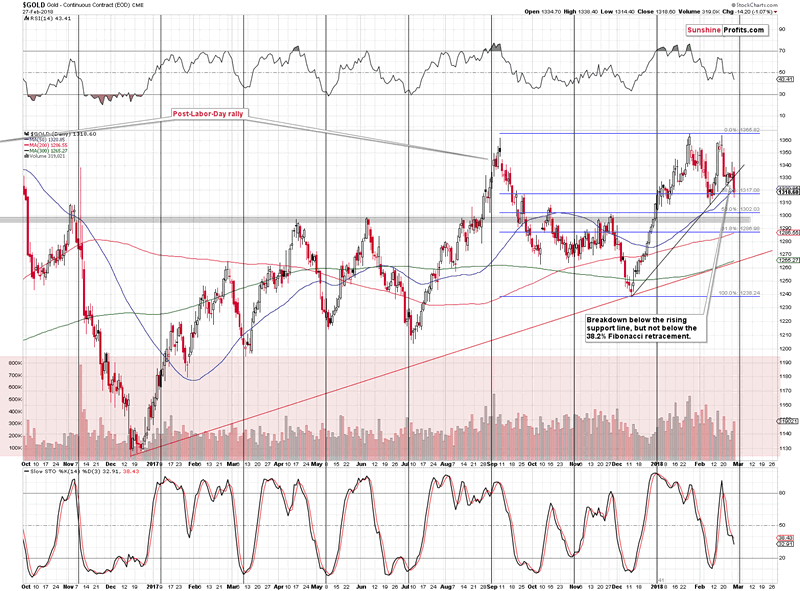
Justas the USD Index moved close to its previous highs, the price of gold moved toits previous lows. It also broke below the rising support line based on theprevious short-term lows. Gold is at its 38.2% Fibonacci retracement, which isan important short-term support level. The previous breakdown below it wasinvalidated and followed by an upswing, so gold could still move temporarilyhigher.
Still,if silver is to outperform gold and the former is to move close to its recentshort-term high, then gold should not move as high. The volume that accompaniedMonday’s move higher was rather low, which suggests that the strength of thebulls is limited. It fits the scenario in which gold moves higher for a fewdays (to gold’s cyclical turning point which is marked with a vertical line) ora week and a few days and then starts a big slide.
Again,there are multiplelong-term factors in play that favor lower gold prices and they couldtrigger a decline regardless of the short-term signals – the surprises can andare likely to be to the downside.
Consequently,the medium-term outlook remains bearish, but just as we are skeptical regardingthe USD’s breakout, we are still skeptical regarding gold’s short-termbreakdown below the rising support line. Yes, it’s bearish, but we will not besurprised by another attempt to move higher before the big slide starts.
Thelatter is certainly possible in light of silver’s self-similar pattern.
Silver’sSelf-similarity
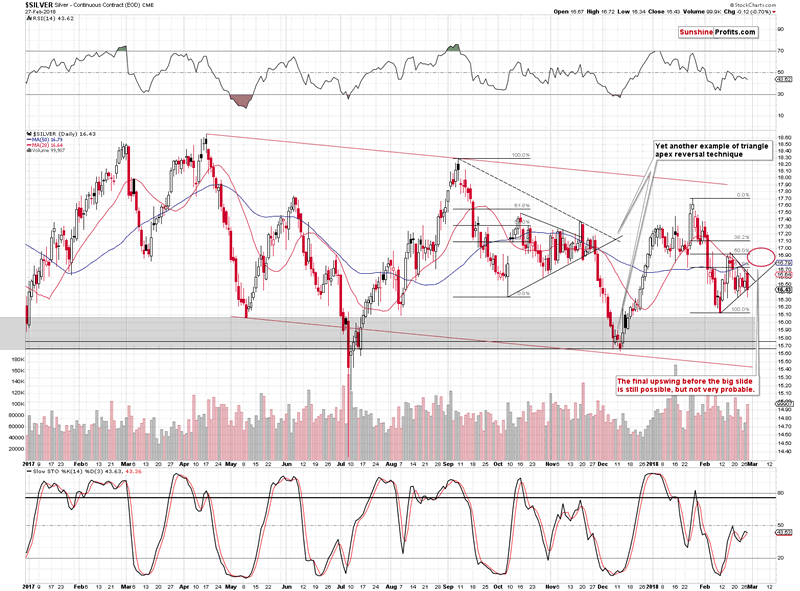
Silverseems to be repeating its performance from the second half of the previous year.
TheJanuary 2018 – February 2018 decline is a quicker version of the September –October 2017 downswing. The subsequent corrections are very similar – in bothcases, silver moved a bit above the 50% Fibonacci retracement, but not abovethe 61.8% one. The following decline erased most of the correction. Then, backand forth trading started where intraday highs were not as high as the highestintraday price of the preceding corrective upswing. The intraday lows ofsubsequent sessions were increasing.
Theinitial corrective upswing also took silver above both moving averages: the 20-and 50-day one. Then, the back and forth trading took place around the redmoving average, but below the blue one. That’s what happened on Monday – silvermoved a bit above the red MA, but not above theblue one.
Havingestablished the self-similarity, let’s see how we can use it.
Wecan use to determine the next silver turning point and the tradingopportunity. In this particular case, we see that the final top and the superbopportunity to go short presented itself in mid-November, when silver ralliedabove the declining resistance line based on the previous intraday highs andvisibly above the blue (50-day) moving average.
Ittook a bit more time for silver to rally in November 2017 than it did for it todecline in October, so in this case, we can expect silver to take a bit moretime to rally than it did to decline in the second half of February.
Combiningthe above price and time analogies, we get the target that we marked with a redellipse on the above chart. The target is quite wide and there are good reasonsfor it. Back in November, silver topped below the previous top, but silver isknown to get ahead of itself during these intraday outperformance cases, sowe’re not ruling out a scenario in which it “breaks out” above the mid-Februarytop only to invalidate the “breakout” shortly thereafter.
Asfar as time is concerned, please recall that in Monday's free analysis we thoroughly discussed the apex triangle reversal techniquefor gold and it pointed to two scenarios: one in which the top isalready in and a second one inwhich the top is going to be in in about two weeks (a bit less, counting fromtoday). Moreover, gold’s cyclical turning pointis tomorrow, so it could be the case that it triggers silver’s rally and thesubsequent reversal. Overall, it’s rather unclear when precisely the silver reversal willtake place, but we know more or less when to expect it and we know what signsto look for as a confirmation (silver’s breakouts above the declining,short-term resistance line and the 50-day moving average).
Speakingof apex-triangle-based reversals, please note that the above chart shows yetanother confirmation of this technique’s usefulness. The triangle based on theOctober and November 2017 lows (solid line) and the September and November 2017tops (dashed line) had their apexes exactly at the time when one would want toreverse their short positions or close them. Perhaps applying this technique tothe upcoming decline will serve as a way to detect a short-term reversal aswell.
Duringyesterday’s trading, silver moved a bit below the rising short-term supportline, but closed right at it, without a meaningful breakdown. The volume thataccompanied it was significant, which is bearish, but please note that sincethe back-and-forth movement in silver still continues and the self-similarpattern remains in place, we should still take into account the possibility ofa quick upswing right before the slide.
GoldStocks’ Breakdown
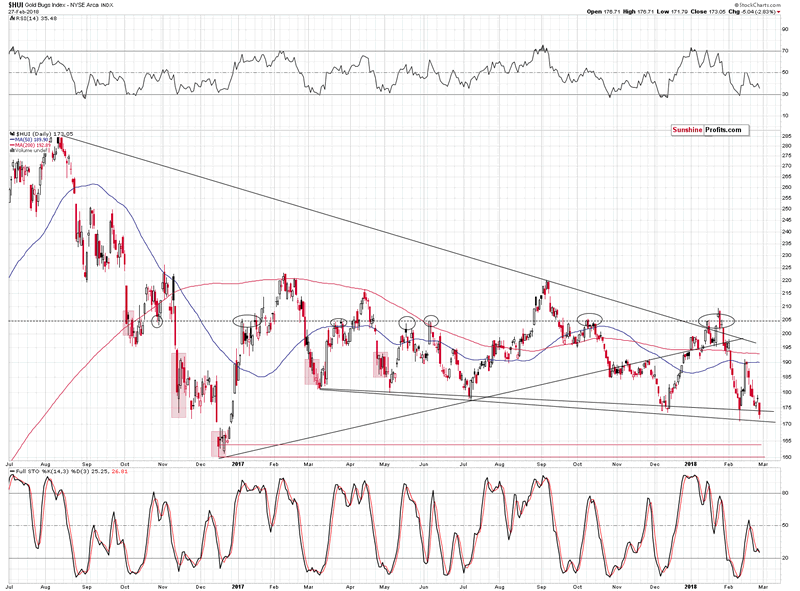
Goldminers declined substantially yesterday and closed at new 2018 lows, which means thatthey also broke below the previous 2017 lows. There was no new intraday low,but the closing prices are more important with regard to breakdowns belowimportant price levels.
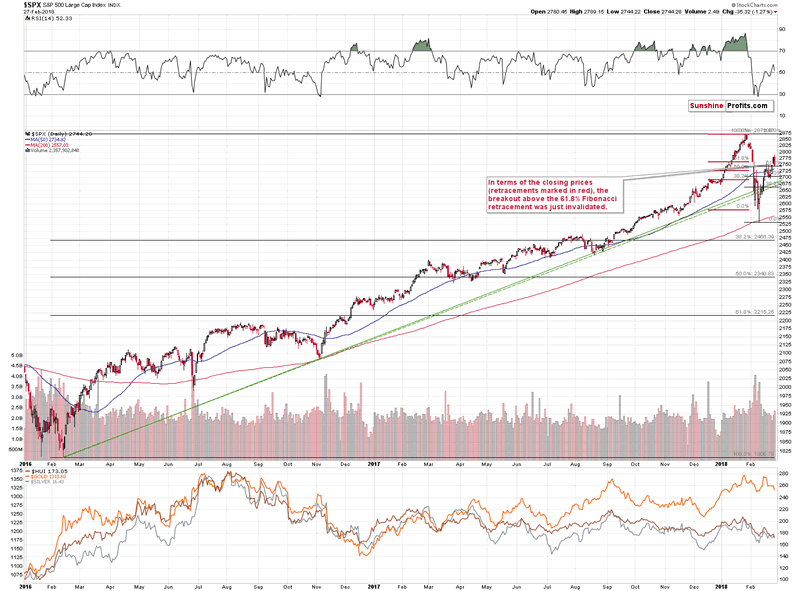
Moreimportantly, this time, the breakdown was not triggered by a huge and volatiledecline in main stock indices. The S&P Index is above the 50% Fibonacciretracement based on the decline, so it’s definitely not moving to new lows.Therefore, the gold stocks’ performance represents true weakness of the PMsector.
Bythe way, the S&P 500 Index just invalidated the breakout above the 61.8%Fibonacci retracement level based on the daily closing prices, so we might (!)see another slide lower.
Movingback to mining stocks, the breakdown below the previous 2017 and 2018 lows isnot yet confirmed as that was just one daily close, but in light of the long-termbreakdowns in the gold stocks to gold and gold stocks to S&P ratios, itseems that bearish outlook is definitely justified.
But,does the above rule out the possibility of seeing another move higher beforethe big slide in the miners begins? It’s definitely less likely than it wasbefore yesterday’s session, but it’s still possible.
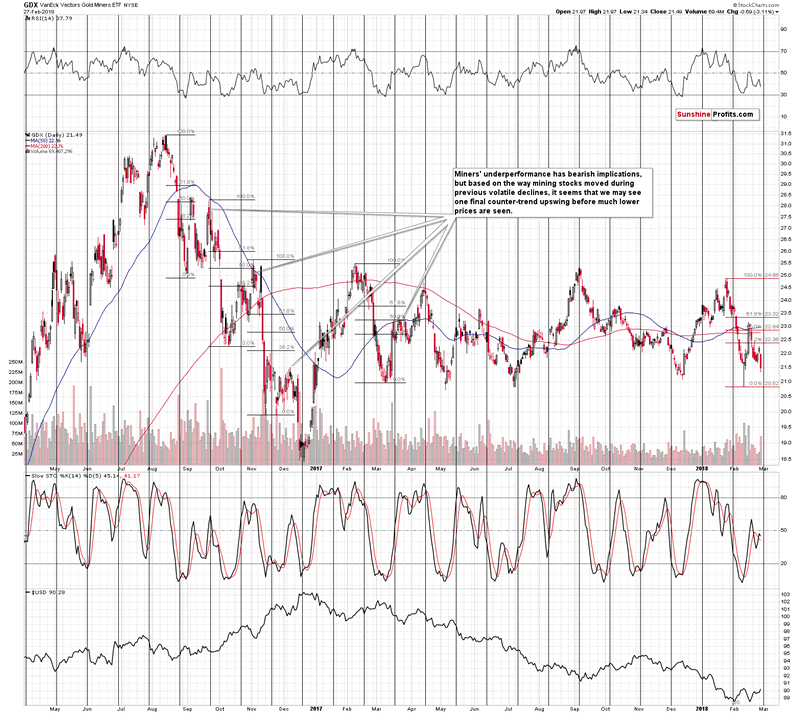
Asa reminder, during the previous volatile declines, gold and silver miningstocks quite often corrected twice before another big wave down started. Is this timeany different? It could be the case based on the mentioned breakdowns in theratios, but it’s not certain.
Whilewe’re at it, we would like to provide you with a reply to a question that wereceived about using the RSI to time the upcomingbottom in the GDX. Our price targets may (and it even seems likely) correspondto the RSI below 30, so the question is if the targets are not too low. Here’sour take.
Itseems that we have entered the stage in the precious metals market whereaggressive downside targets for mining stocks are justified. The reasons arethe key breakdowns in the HUI to gold and the HUI to S&P ratios that yousaw in Monday’s alert. Based on them we should expect a lot of negativity frommining stocks in the coming weeks and months. The RSI around (!) 30 is abullish factor, but please keep in mind that targets based on prices are moreprecise than those that are based on the RSI.
Forinstance, about a year ago, on March 2nd, the RSI for GDX was at about 32 whenGDX closed at 21.75. It was relatively close to the bottom, but the true bottomformed only once RSI moved below 30 in the following days. On March 9, theclosing price was 20.97 - about 4% lower. In August 2016, the RSI-around-32bottom was $26.68, and the real bottom was several days later with RSI below 30and GDX at $25.21 (closing price). About 6% lower.
Thekey thing, however, is what happened during the 2013 decline - as that’s whatwe think is likely to be seen once again. In late January 2013, the RSI around30 served as a good buy signal but only for the immediate future. In fact, formany investors, it would have been better to stay short at that time. Mostsubsequent bottoms were formed with the RSI at or below 25 and exitingpositions with the RSI at 30 would have been very premature.
Concluding,the RSI may not be as effective in the next several months as it was in thepast 2 years or so. Even if it is, bottoms may form with the indicator a bitbelow 30, instead of being a bit above it. Consequently, it seems better tolook at the price levels based on support lines, retracements and other techniquesthan to put huge weight to the RSI’s indication. It’s still going to beimportant, but not to the extent it used to.
Little-knownConfirmation from Palladium
Somesigns, like breakouts and breakdowns are clearly visible, but some are knownonly to those who have been in the market for a long time and have taken thetime to analyze it thoroughly. One of the latter sings comes from the palladiummarket.
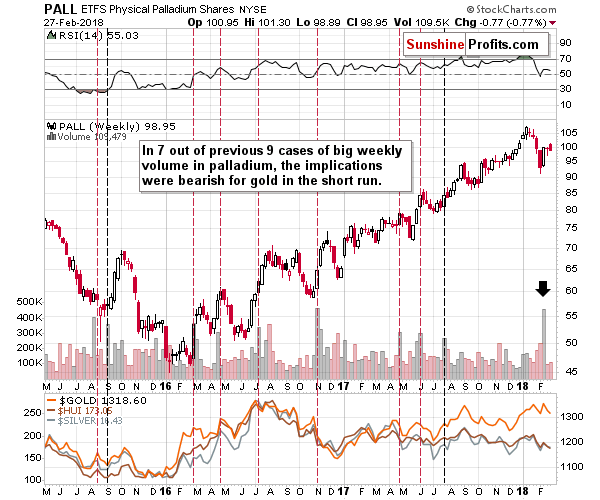
Theless-popular white metal provides us with important short- and medium-termsignals, but only if one knows where to look. The volume that accompanies theweekly upswing is the thing that can help us determine what kind of move weshould expect. The size of the palladium market is limited and it’s not aspopular as gold or silver, so sudden increases in the buying activity may implybig upswings in interest among individual investors (this market may be toosmall for many institutions).
Wheredo people want to “buy buy buy!”? At the tops. Therefore, the big increase inthe volume may indicate a surge in the sentiment, which in turn indicates alocal top. The above worked in 7 out of 9 recent cases, so it seems that theabove kind of link does indeed exist. Consequently, the implications of themost recent weekly upswing are bearish and the above strengthens the alreadybearish case.
Summary
Summingup, the top in gold, silver and mining stocks is probably in, but there’s stilla possibility that the PMs’ decline will be delayed by a few days or a week. Mining stocksand – in particular – silver will be the assets to look at for necessaryconfirmations before making adjustments to the current trading position. However,based on the information that we have today (we’ll provide follow-ups in our daily alerts), it seems that inboth cases the outlook for the following months will remain bearish.
If you enjoyed the above analysis and would like toreceive free follow-ups, we encourage you to sign up for our gold newsletter –it’s free and if you don’t like it, you can unsubscribe with just 2 clicks. Ifyou sign up today, you’ll also get 7 days of free access to our premium dailyGold & Silver Trading Alerts. Signup now.
Thank you.
Przemyslaw Radomski, CFA
Founder, Editor-in-chief
Toolsfor Effective Gold & Silver Investments - SunshineProfits.com
Tools für EffektivesGold- und Silber-Investment - SunshineProfits.DE
* * * * *
About Sunshine Profits
SunshineProfits enables anyone to forecast market changes with a level of accuracy thatwas once only available to closed-door institutions. It provides free trialaccess to its best investment tools (including lists of best gold stocks and best silver stocks),proprietary gold & silver indicators, buy & sell signals, weekly newsletter, and more. Seeing is believing.
Disclaimer
All essays, research and information found aboverepresent analyses and opinions of Przemyslaw Radomski, CFA and SunshineProfits' associates only. As such, it may prove wrong and be a subject tochange without notice. Opinions and analyses were based on data available toauthors of respective essays at the time of writing. Although the informationprovided above is based on careful research and sources that are believed to beaccurate, Przemyslaw Radomski, CFA and his associates do not guarantee theaccuracy or thoroughness of the data or information reported. The opinionspublished above are neither an offer nor a recommendation to purchase or sell anysecurities. Mr. Radomski is not a Registered Securities Advisor. By readingPrzemyslaw Radomski's, CFA reports you fully agree that he will not be heldresponsible or liable for any decisions you make regarding any informationprovided in these reports. Investing, trading and speculation in any financialmarkets may involve high risk of loss. Przemyslaw Radomski, CFA, SunshineProfits' employees and affiliates as well as members of their families may havea short or long position in any securities, including those mentioned in any ofthe reports or essays, and may make additional purchases and/or sales of thosesecurities without notice.
Przemyslaw Radomski Archive |
© 2005-2018 http://www.MarketOracle.co.uk - The Market Oracle is a FREE Daily Financial Markets Analysis & Forecasting online publication.