Gold Technical Analysis: Pullback to ascending 5-day MA likely
By Omkar Godbole / February 21, 2019 / www.fxstreet.com / Article Link
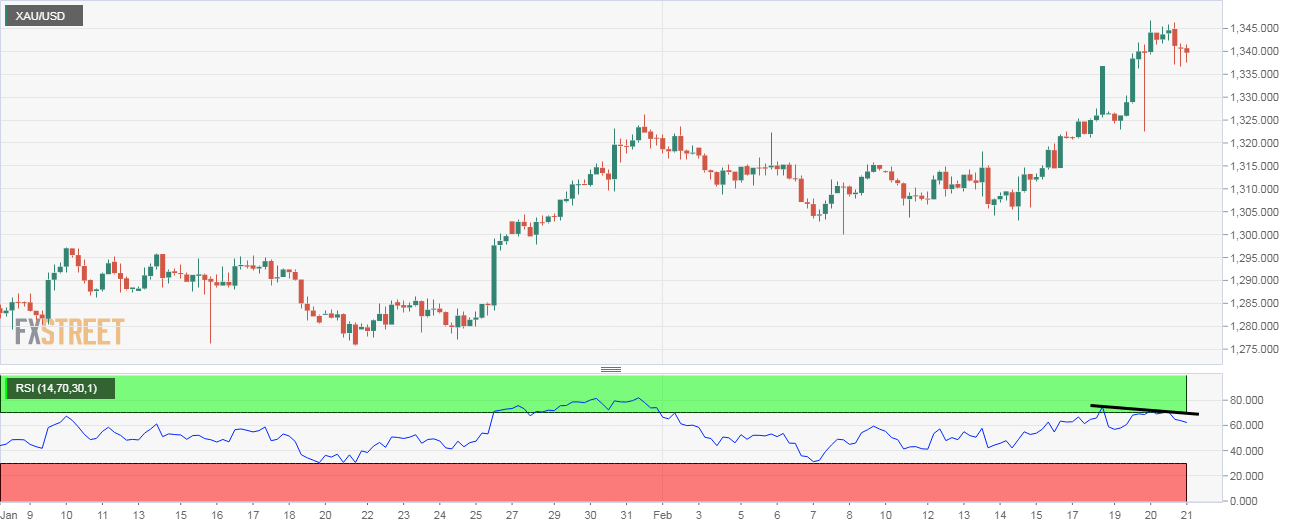
Gold is currently trading at $1,340, having clocked a high of $1,346.85 yesterday.
On the daily chart, the safe haven yellow metal carved out a doji candle yesterday, signaling indecision/bullish exhaustion. Further, on the 4-hour chart, the RSI has diverged in favor of the bears.
Therefore, the yellow metal could fall back to the ascending 5-day moving average (MA) support, currently lined up $1,335.
Daily chart
-636863164225059774.png)
4-hour chart
Trend: Minor correction likely
R3 1373.88 R2 1360.37 R1 1349.63 PP 1336.12 S1 1325.38 S2 1311.87 S3 1301.13Recent News
Immediate trigger for crash was new Fed Chairman pick
February 02, 2026 / www.canadianminingreport.com
Gold stocks slump on metal price decline
February 02, 2026 / www.canadianminingreport.com
Is the gold market starting to turn 'irrationally exuberant'?
January 26, 2026 / www.canadianminingreport.com
Gold stocks explode up as equity markets languish
January 26, 2026 / www.canadianminingreport.com
Gold stocks outpace flat large caps
January 19, 2026 / www.canadianminingreport.com