Gold Technical Analysis: Rejected at 4H 200MA, hourly RSI diverges in favor of bears
By Omkar Godbole / March 14, 2019 / www.fxstreet.com / Article Link
Gold jumped to 4-hour 200-candle moving average (MA) of $1,311 earlier today, as expected, but failed to take out the key hurdle and is currently trading at $1,308.
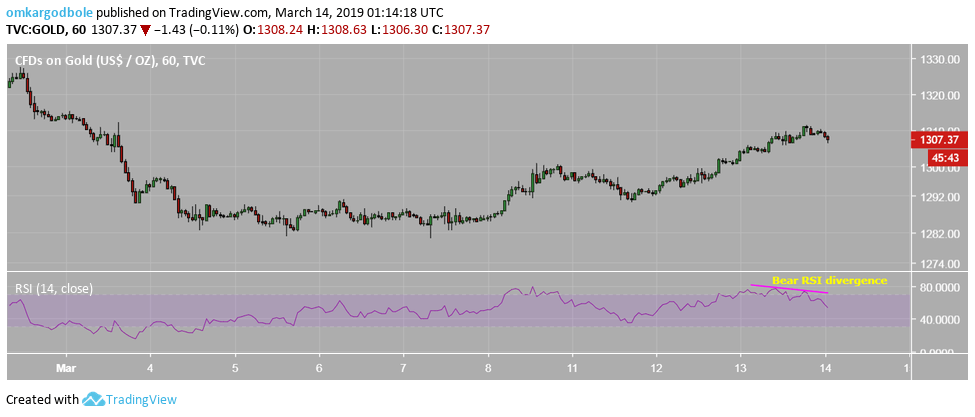
The hourly chart relative strength index (RSI) has rolled over from the overbought territory, creating lower highs in favor of the bears.
Meanwhile, rejection at the 200-candle MA has strengthened the bearish case put forward by the negative crossover of the 100- and 200-candle MAs on the 4H.
The yellow metal, therefore, could see a minor pullback to $1,303-$1,300 levels. A break above the 4H 200-candle MA of $1,311 is needed to revive the bullish view.
4-hour chart
-636881229404221043.png)
Hourly chart
Trend: Pullback likely
R3 1326.55 R2 1319.67 R1 1314.4 PP 1307.52 S1 1302.25 S2 1295.37 S3 1290.1Recent News
Immediate trigger for crash was new Fed Chairman pick
February 02, 2026 / www.canadianminingreport.com
Gold stocks slump on metal price decline
February 02, 2026 / www.canadianminingreport.com
Is the gold market starting to turn 'irrationally exuberant'?
January 26, 2026 / www.canadianminingreport.com
Gold stocks explode up as equity markets languish
January 26, 2026 / www.canadianminingreport.com
Gold stocks outpace flat large caps
January 19, 2026 / www.canadianminingreport.com