Gold: The Big Picture
Nothing impacts gold prices quite like the Fed policy.
Gold has appreciated by nearly 3,800% since the dollar decoupled from gold in the 1970s, and in that time, the U.S.'s monetary base exploded by roughly 4,300%.
It appears that the Fed is about done with its tightening program, and an upcoming economic slowdown will likely push the Fed towards halting QT, lowering rates and implementing QE.
There are numerous other constructive fundamental, technical, and psychological variables that suggest gold is likely going substantially higher from here.
Ultimately, this is likely an extremely good time to accumulate gold, gold miners, and other gold-related assets.
 Source: DailyTimes.com
Gold: The Big Picture
Gold has performed remarkably well over the past 6 months. The outperformance began in the fall, right around the time equities topped out, and the odds of further Fed tightening began to disintegrate.
In my gold article from last August, at the height of gold's precipitous declines, I urged investors not to panic about the sliding price of gold. I concluded that gold was going through a healthy correction, and its long-term trend should remain upward, despite the short-term gyrations.
Incidentally, gold bottomed on the day my article was published, and the yellow metal has gone on to surge by roughly 15% since. However, despite gold's strong performance over the past 6 months, the precious metal's rise is likely just getting started.
Multiple fundamental, technical, and psychological factors point to the distinct probability of gold going substantially higher, especially over the intermediate, and longer-term. Hence, now remains a good time to continue to accumulate gold and gold-related assets, as they will likely be worth substantially more several years down the line.
Gold Price: A Brief History
Since the 1970s, gold has been headed in only one direction, and that's dramatically higher. In fact, gold has surged by about 3,760% since 1970, outpacing the DOW's 3,190% move, and besting the S&P 500's 2,980% return in that time frame.
Gold Price

Source: MacroTrends.com
The current monetary base is roughly $3.34 trillion, the M2 money supply is more than $14.6 trillion, treasury securities are at about $1.17 trillion, and total dollar-denominated currency and credit derivatives are at a staggering $628 trillion right now.
Now, if we look at the monetary base, it was at about $76 billion in 1970. So, while gold has appreciated by about 3,760% since 1970, the monetary base has increased by about 4,300% since then.
Monetary Base

Source: stlouisfed.org
However, it is not only about the monetary base, as much of the "dollars" are camouflaged by countless trillions in debt and derivatives. I am not sure that there were many derivatives in 1970, so let's look at some more recent data, from 2000.
Just since 2000:
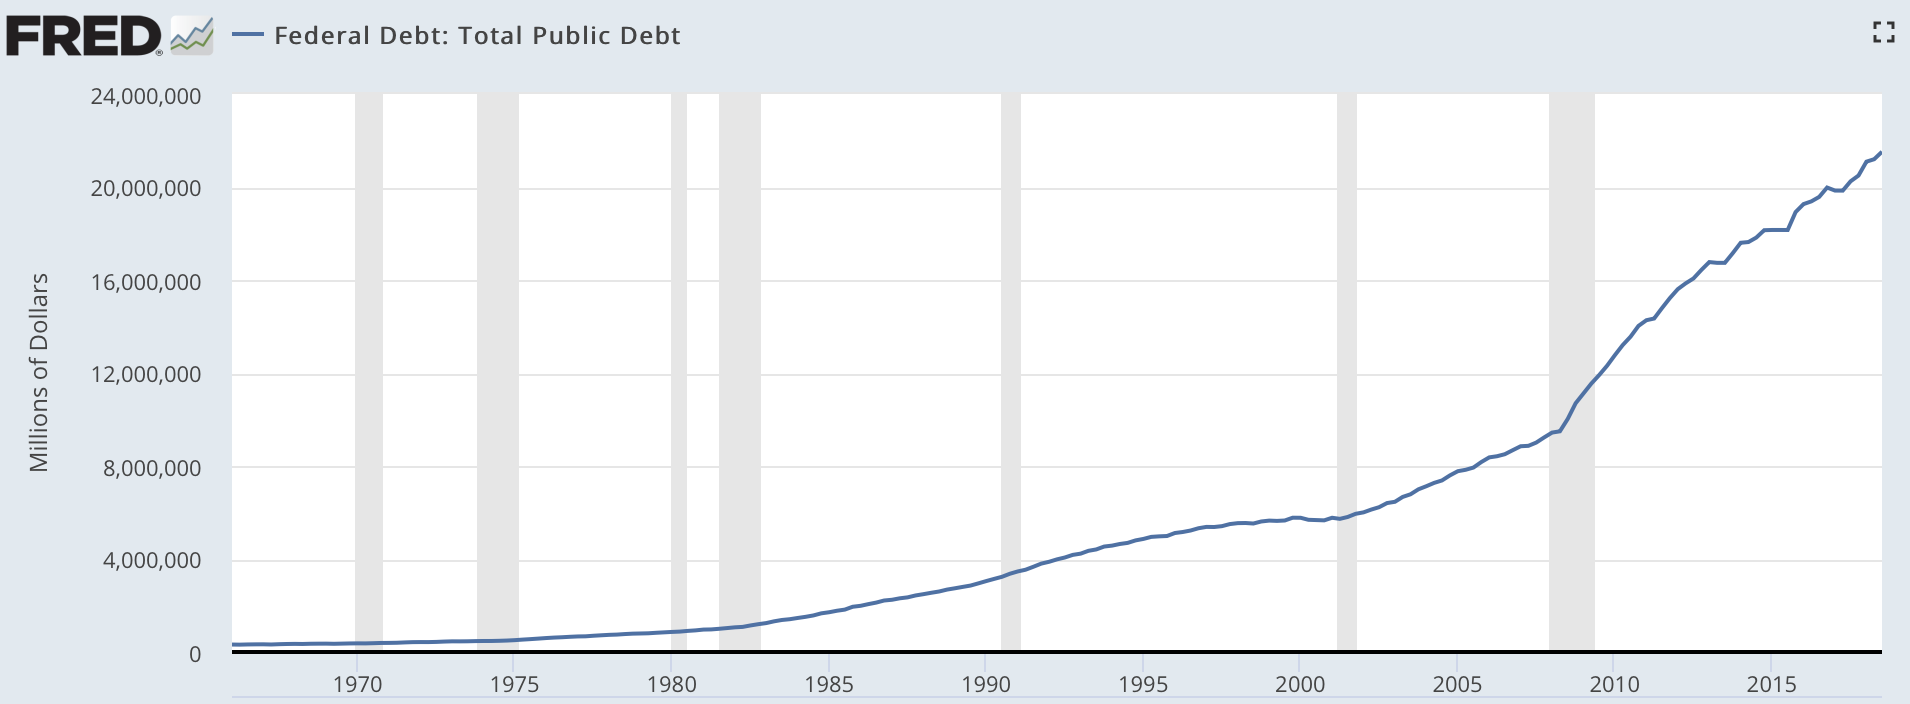
The U.S.'s monetary base has increased by 451%, from $606 billion to $3.34 trillion. Treasury securities have surged by 883%, from $118 billion to $1.16 trillion. Derivatives have exploded by 605% from $88.9 trillion all the way up to $628 trillion. Meanwhile, gold has gained a modest 378% in that time. The U.S. national debt has grown by 293% since 2000. U.S. GDP has increased by only 127%.These are big numbers, so let's try to put them into some perspective. The U.S. continues to expand its monetary base, debt, treasury securities, and derivatives at an alarming pace. We see that GDP is not able to keep up with debt accumulation, and debt accumulation has surpassed GDP growth by a shocking margin over the past 20 years.
U.S. Federal Debt
U.S. Debt to GDP
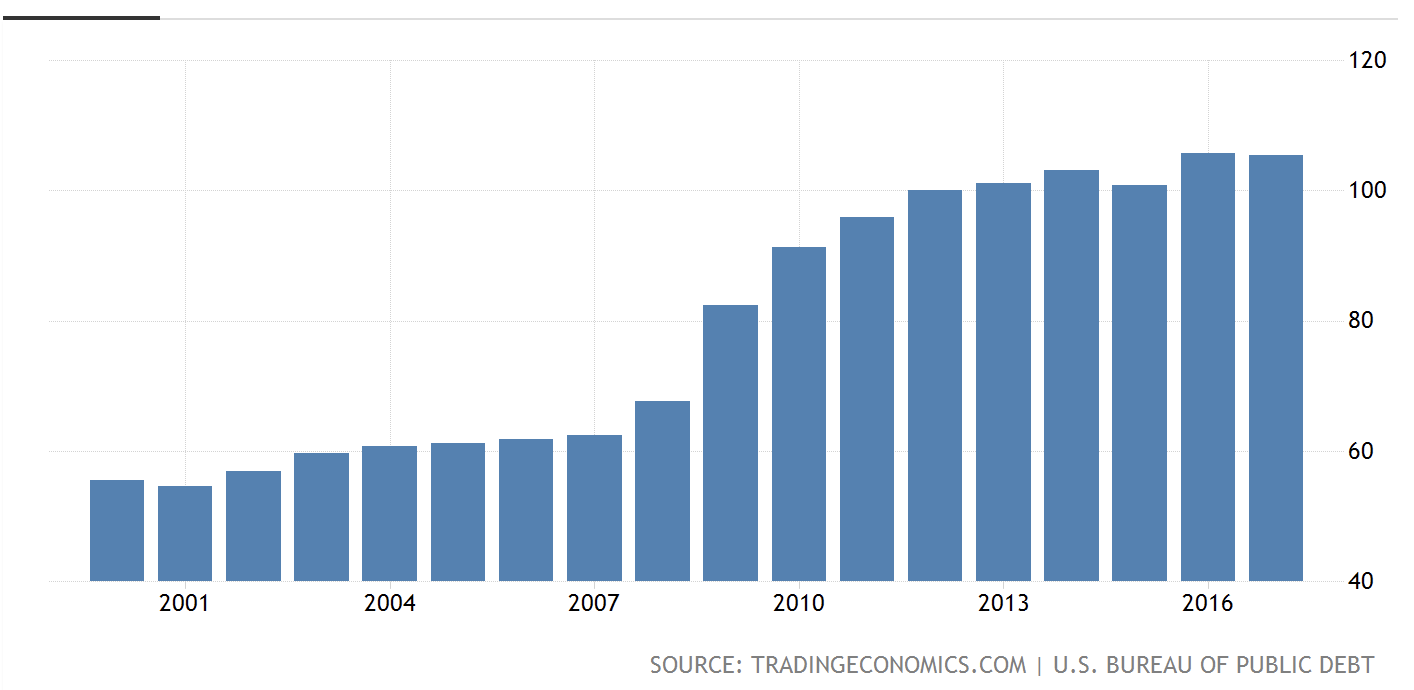
Source: TradingEconomics.com
This indicates that the U.S. will need ultra-low rates and further expansion of the monetary supply to dilute and service the enormous mounting debt. Furthermore, we can see that throughout history gold has appreciated essentially in tandem with the U.S.'s monetary base.
Since 2000 the monetary base increased by 451% and gold appreciated by 378%. Since 1970, the monetary base has increased by 4,300% and gold by 3,760%. We can clearly see the correlation here, and it makes sense as the more the monetary supply of the world's reserve currency (dollar) gets diluted the higher gold prices should go.
Another factor to highlight is that the monetary base has been contracting after peaking in 2014. The monetary base peaked at slightly over $4 trillion in 2014, and is now around $3.34 trillion, roughly 16.5% below the peak.
This is because the monetary base essentially quintupled in the years following the 2008 financial crisis due to all the QE and zero rate policies. Now with QT and higher rates, the monetary base has been contracting and this has had a somewhat negative effect on gold prices.
However, with the Fed's tightening path near completion now and with a possible recession on the horizon, it is extremely unlikely that the monetary supply will remain constrained for long. In fact, it is likely that the Fed will need to halt its QT program, will cease raising interest rates, will revert to rate easing, and will even likely introduce further rounds of QE when the next downturn arrives.
Therefore, the money supply will likely stop contracting, and will begin expanding once again relatively soon. This is extremely bullish for gold, and the Fed is already showing signs of capitulation.
The Fed and the Perpetually Expanding Money Supply
Decoupling from the gold standard was the greatest thing that had ever happened to the Fed. After 1970 the Fed's hands got untied, and it essentially got the green light to inflate the U.S. money supply by as much as it saw fit.
 Source: Shutterstock.com
With all the inflating post the financial crisis, I am surprised gold did not go much higher. We saw the monetary base explode by about 380% from just $840 billion in 2008 to over $4 trillion in 2014. Yet, gold increased by just 150% from 2008 to 2011, and by 2014 gold had entered a turbulent bear market (right as the monetary base began to contract).
So, why has gold underperformed?
While several factors can be attributable to gold's "recent" decline (2011 - 2016), one often overlooked factor is that the gold market appears to be forward-looking. Gold had a sharp rally in the anticipation of all the QE, and then entered a bear market in the anticipation of higher interest rates and the contraction of the monetary base.
However, the monetary base never got reduced by nearly as much as it was inflated by, and likely never will. The gold market sees this, and that is why gold has held up relatively well in recent years despite monetary contraction.
The good news for gold is that the monetary supply is likely to stop contracting, and should begin to expand once again. The gold market is starting to see this, and that is why gold has been outperforming in recent months.
People often say that gold is a good hedge for fear in the market, a recession, and so on. However, it is not so much that gold is a good hedge against fear or a recession, as it is a great investment in times of monetary expansion.
The Fed's number one tool for dealing with a slowdown or a recession is to inflate the money supply by lowering rates and/or by introducing QE. That is why gold continuously goes higher, as its price has a direct correlation to the number of dollars circulating the planet.
Fed Likely to Halt Monetary Contraction
We know that the monetary base has shrunk by about 16.5% from its peak in 2014. However, the monetary base is still about 300% higher or quadruple what it was in 2008, while gold is only up by about 85% in the same time frame. This implies that gold could have a lot of catching up to do, and it also suggests that many market participants may be behind the curve on the Fed's likely path going forward.
The Fed is no longer expected to raise rates at all in 2019. In fact, there is about a 75% chance rates will be right where they are today in 2020. Also, if you thought the other 25% would be pointing to a chance of higher rates one year from now you'd be wrong.
The market now gives less than a 2% chance that rates could be just a quarter point higher in a year, and instead gives almost a 25% chance that rates will be lower a year from now.
Rate Expectations for January 2020
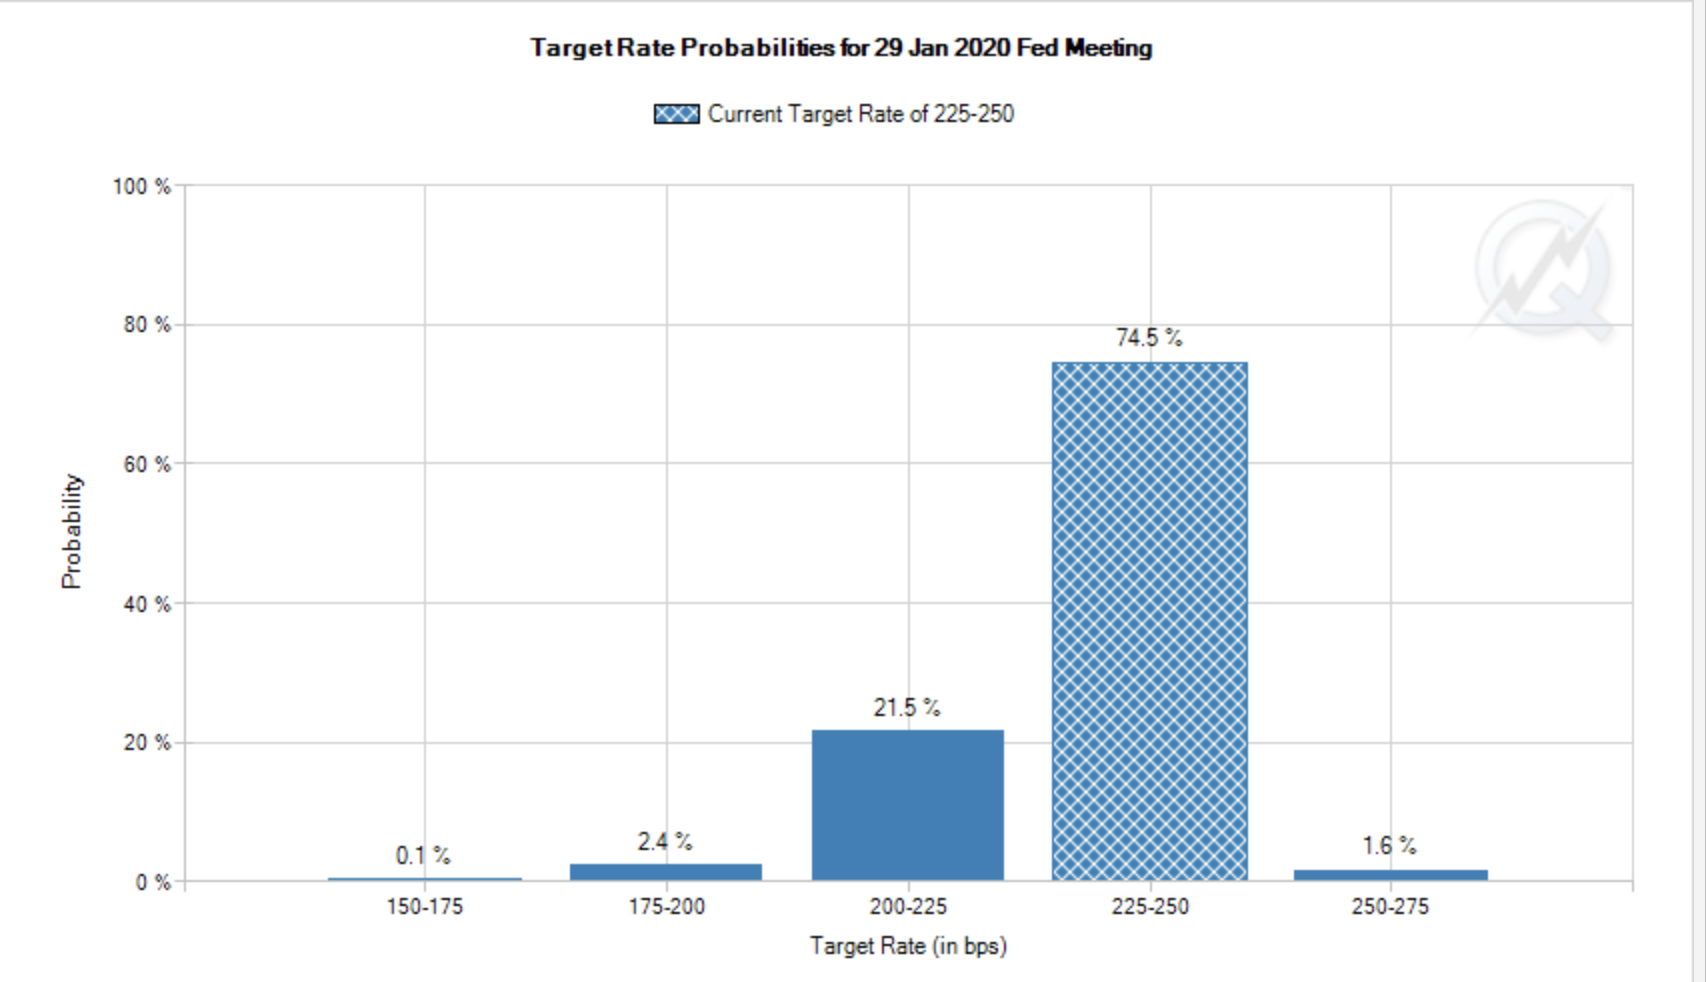
Source: CMEGroup.com
This also implies that the Fed's QT program will be discontinued soon, as it is extremely unlikely to see rates lowered without stopping QT first. Also, if there is a stop to QT, and rates are lowered, the next step would be to reintroduce fresh rounds of QE, and that will cause the monetary base to expand stupendously once again.
Why would the Fed do this?
Well, it's simple, the economy cannot expand forever, and this economy probably cannot withstand higher rates. We clearly saw the growth shocks last fall and early winter, growth nearly stalled, and stocks were crashing. The Fed very quickly changed its stance on monetary policy, realizing the economy was in no shape to withstand higher interest rates, even incrementally higher.
Therefore, interest rates are not likely to go higher, and even if they do, they are likely to cause the economy to stall and go into a slowdown or a recession. Furthermore, the current expansion is already the longest in history, and will very likely come to an abrupt end relatively soon. Therefore, look for a halt to QT, lower interest rates, additional rounds of QE, and substantially higher gold prices over the next several years.
Gold has been relatively subdued in recent years, partly because many market participants were expecting significantly higher interest rates to materialize, and a lot more money to be sucked out of the system.
Therefore, gold has a lot of catching up to do, and once the flood gates are opened, and most market participants realize looser monetary policy is far likelier than a tighter one, gold could conceivably go a lot higher than many people perceive is possible.
Other Signs Supportive of Higher Gold Prices
Despite the nice 15% appreciation over the last 6 months, there are numerous indicators that suggest gold prices are just getting started here.
COT Report
If we look at the COT report, we see that gold just went through one of its most bearish periods in history. The COT report showed negative figures for 10 weeks straight throughout the summer of 2018.
COT Chart
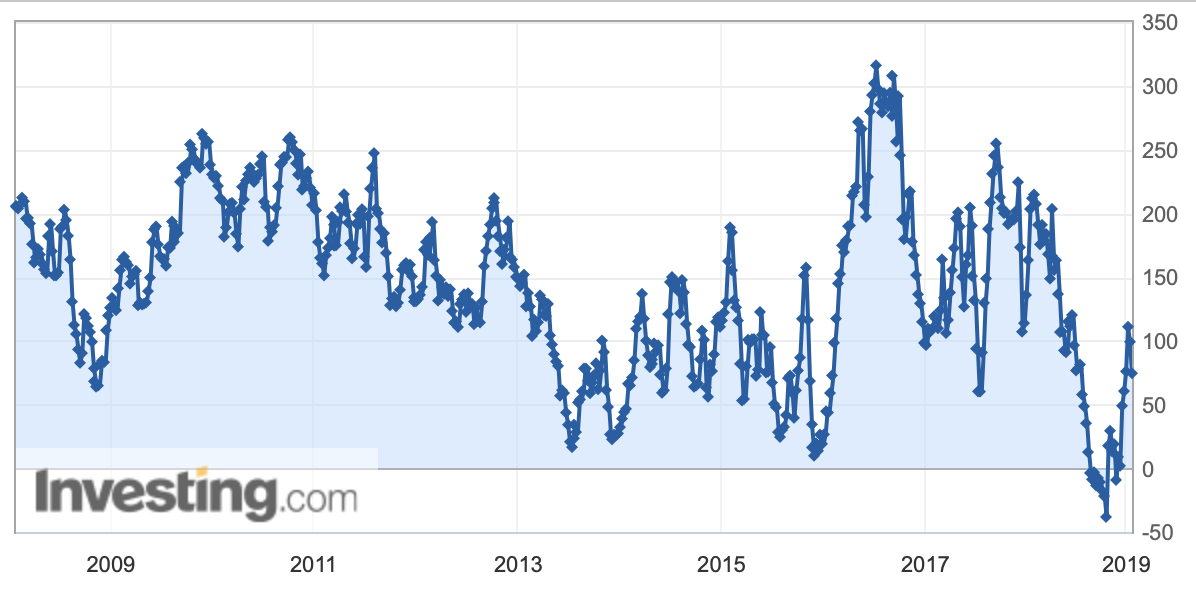
Source: Investing.com
Sentiment this bearish amongst speculators had not been observed at any time in the last 10 years. This suggests many market participants had become incredibly bearish on gold and are likely just now starting to recalibrate their positions. This period of unprecedented bearishness also likely marked a substantial low in the market.
Gold to Silver Ratio
The gold-to-silver ratio is around 84 at the time of writing this article. This is an incredibly elevated figure and implies that the gold market is still close to a rock bottom based on historical standards.
Gold to Silver Ratio 20 Year Chart
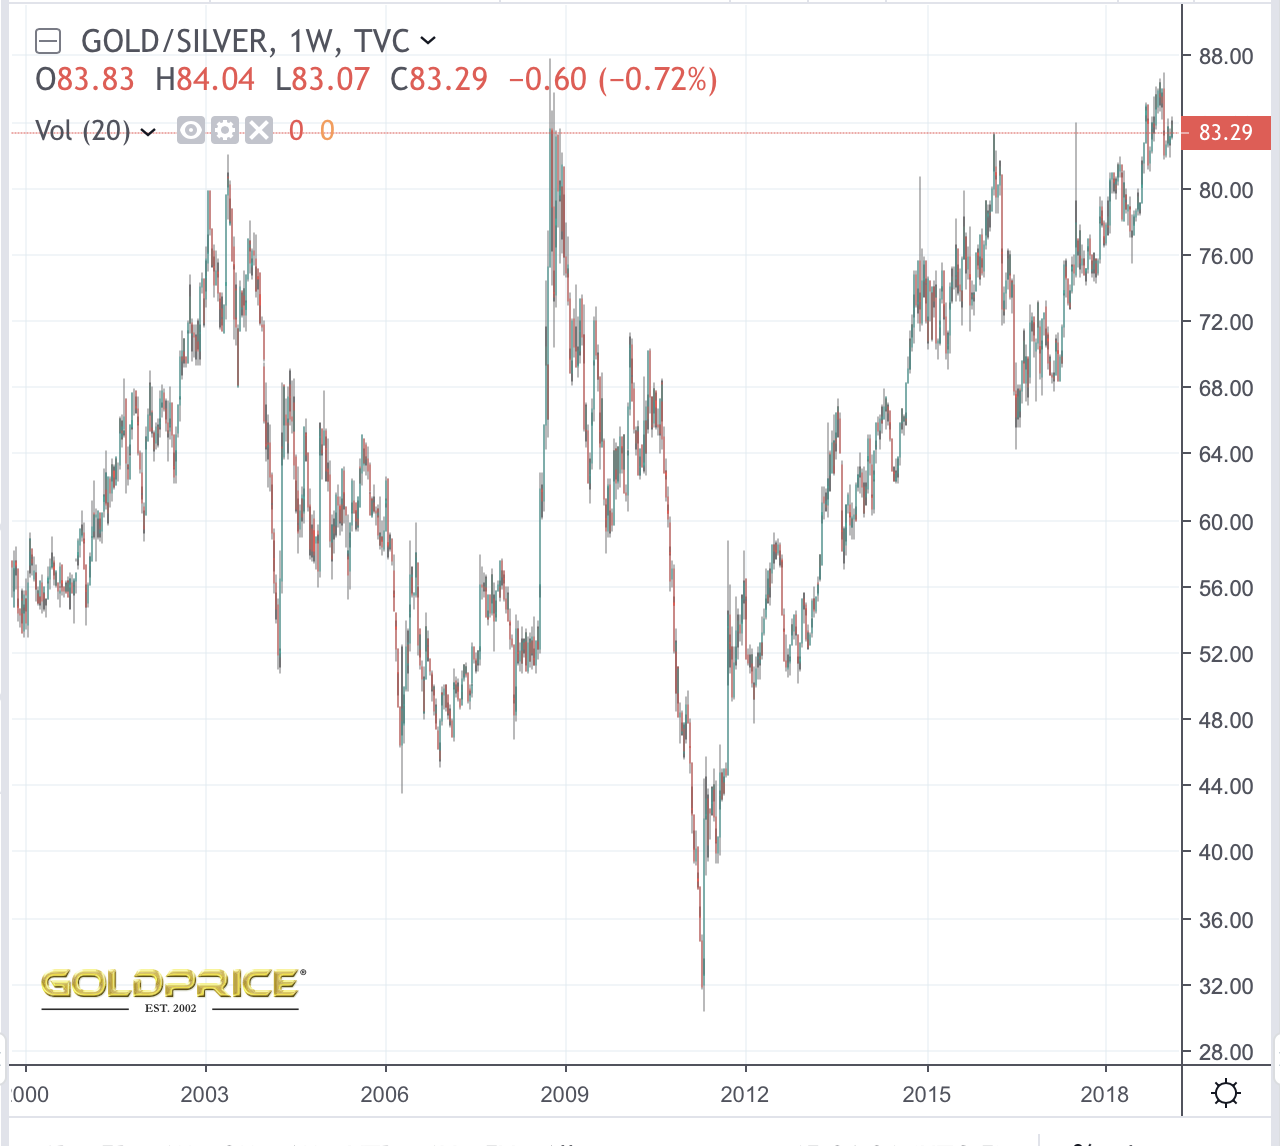
Source: Goldprice.org
Every time this ratio got to a level above 80 over the past 20 years it led to significant rallies in gold. This happened in the early 2000s, in 2008, in 2016, and it's happening now.
Bond Rates
Bond rates are still relatively low, which is good for gold as bonds represent a competing safe-haven asset class to gold. Low bond rates make gold more attractive, as investors get very little, or even negative real interest for storing their money in bonds. This provides a stronger case to own gold for many market participants who would typically invest money in bonds.
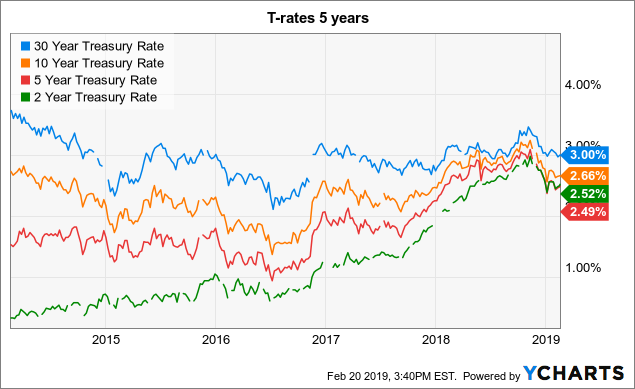 Data by YCharts
Right now, the 5-year is at 2.46%, the 10-year is at 2.64%, the 30-year is at 2.99, and the 2-year is at 2.49%. These rates are extremely close by historical standards, illustrating that a flattening of the yield curve is occurring. Furthermore, the 2-year is yielding more than the 5-year, a very atypical phenomenon known as inversion is occurring.
This phenomenon is suggestive of an upcoming slowdown in the economy, possibly a recession even, as inverted and flattening rates signal that long-term rates will be brought down by Fed intervention soon (lower rates, more QE).
The Dollar
We see that the dollar is plateauing, likely peaking even. As the Fed ceases its path to higher interest rates the dollar's rise will likely be stunted, and the buck will very likely begin to lose significant ground once QT is halted, and even more so once rates are brought down once again. Moreover, the dollar could cascade notably lower when future rounds of QE are implemented.
USD 1-Year
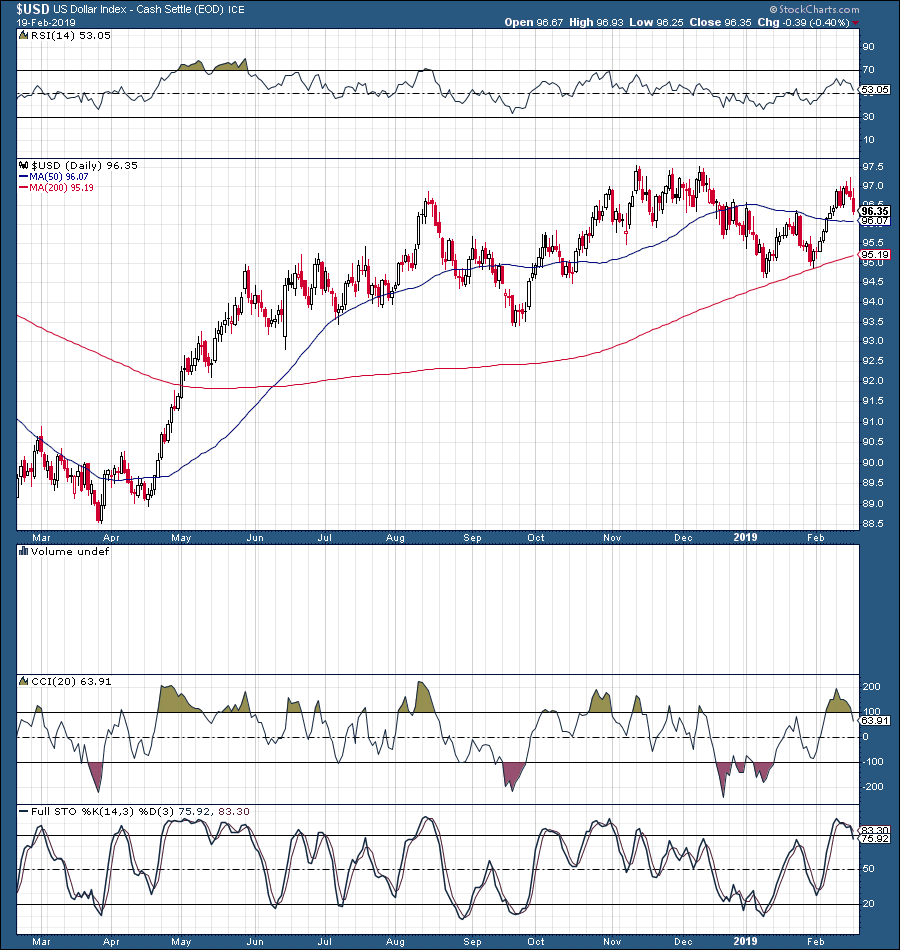 Source: Stockcharts.com
As the dollar falters, gold will very likely go much higher as the dollar and gold have an inverse relationship. Also, a weaker dollar makes gold appear cheaper in alternative currencies, so the yellow metal will likely experience a demand boost as well.
Technical Image
Gold 1-Year
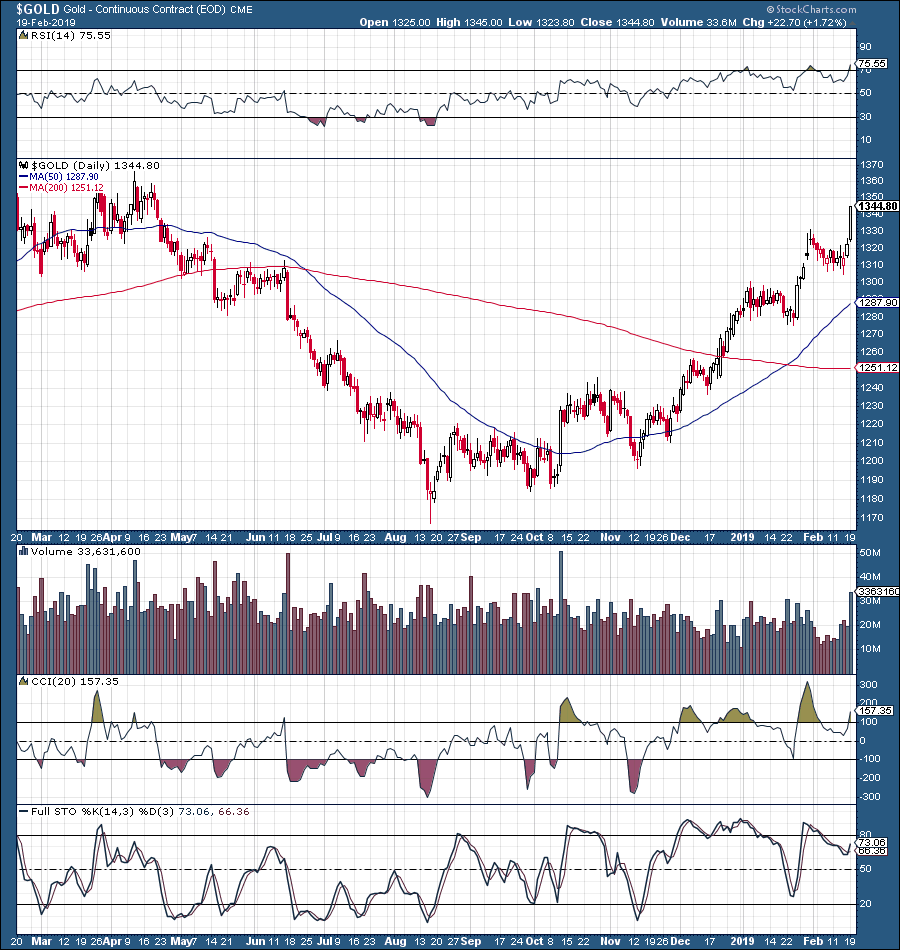 We can see gold making an extremely crisp cup pattern over the past year or so. Next we are likely to see the handle part of the pattern materialize around the $1,350 resistance level. Once some consolidation takes place around this level an extremely bullish cup and handle pattern will be complete, and gold will very likely break out to new multi-year highs above $1,380.
Just Wait Until Sentiment Flips
Sentiment has been horrid in gold for years. Just look back at just about everything since 2011, the extremely bearish times of 2014/2015, record bearishness of 2018, and so on. Investors are only now, just starting to warm to gold, but sentiment could change fast and furiously in the gold market.
Once more market participants begin to catch on that the Fed's likeliest path forward is looser, not tighter, one of the best investment vehicles at this time will be gold. So, expect a shift in sentiment to possibly spark extraordinary demand for gold and gold-related assets in future years.
Bottom Line: Let's Look at The Big Picture
Gold has been the physical asset behind currencies for centuries, and just because the U.S. decoupled the dollar from gold in the 1970s does not mean that monetary policy does not impact gold prices.
In fact, gold's price has followed the U.S.'s monetary base expansion extremely closely for many decades. Therefore, so long as the U.S.'s monetary supply keeps expanding, so will the price of gold long term.
One important factor to highlight is that gold's price has underperformed the money supply's expansion in recent years, possibly due to the expectation for further monetary tightening by the Fed.
However, it appears that the Fed's tightening path has come to an end, as no more rate hikes are expected. Furthermore, the impending future economic slowdown will bring about the end of QT, and will very likely drive the Fed to lower rates and institute further rounds of QE.
This will once again cause the money supply to expand, and gold prices should go much higher this time. Along with the Fed, other factors supportive of much higher gold prices include a period of record bearishness amongst speculators, a sky-high gold-to-silver ratio, relatively low and inverting bond rates, an extremely favorable technical setup, a likely shift in sentiment, and much more.
Ultimately gold will likely continue to appreciate throughout 2019, should go substantially higher in 2020, and will very likely break out to new all-time highs over the next several years.
Disclaimer: This article expresses solely my opinions, is produced for informational purposes only and is not a recommendation to buy or sell any securities. Investing comes with risk to loss of principal. Please consider consulting a professional before putting any capital at risk.
Want more? Want full articles that include technical analysis, trade triggers, trading strategies, portfolio insight, option ideas, price targets, and much more? To learn how to best position yourself for a rally in gold, please consider joining Albright Investment Group!
Subscribe now and obtain the best of both worlds, deep value insight, coupled with top-performing growth strategies.Receive access to our top-performing portfolio that outpaced the S&P 500 by roughly 20% in 2018.Take Advantage of the limited time 2-week free trial offer now and receive 20% off your introductory subscription pricing. Click here to learn more!Disclosure: I am/we are long GOLD, AND OTHER GOLD RELATED ASSETS. I wrote this article myself, and it expresses my own opinions. I am not receiving compensation for it (other than from Seeking Alpha). I have no business relationship with any company whose stock is mentioned in this article.
Follow Victor Dergunov and get email alerts