Gold: The Fed Wreaked Havoc on the Precious Metals / Commodities / Gold and Silver 2021

Gold declined yesterday, or I shouldsay, it rushed down at breakneck speed. And while it might have been a surprisefor some, it wasn’t for me.
However, we should stay alert to anypossible changes, as no market moves in a straight line. Tread carefully.
On a side note, while I didn’t check itmyself (well, it’s impossible to read every article out there), based on thecorrespondence I’m receiving, it appears I’ve been the only one of themore popular authors to be actually bearishon gold before the start of this week. Please keep that in mind, along withme saying that yesterday’s decline is just the beginning, even though ashort-term correction might start soon. Having that in mind, let’s discuss whatthe Fed did (and what it didn’t do) in greater detail.
LookWhat You Did
With the U.S. Federal Reserve’s (FED)reverse-repo nightmare frightening the liquidity out of the system, Ihighlighted on Jun. 17 that the FED raised the interest rate on excess reserves(IOER) from 0.10% to 0.15%.
I wrote:
TheFED hopes that by offering a higher interest rate that it will detercounterparties from participating in the reverse repo transactions. However,whether it will or whether it won’t is not important. The headline is that theFED is draining liquidity from the system and increasing the IOER is anothersign that the U.S. federal funds rate could soon seek higher ground.
Pleasesee below:
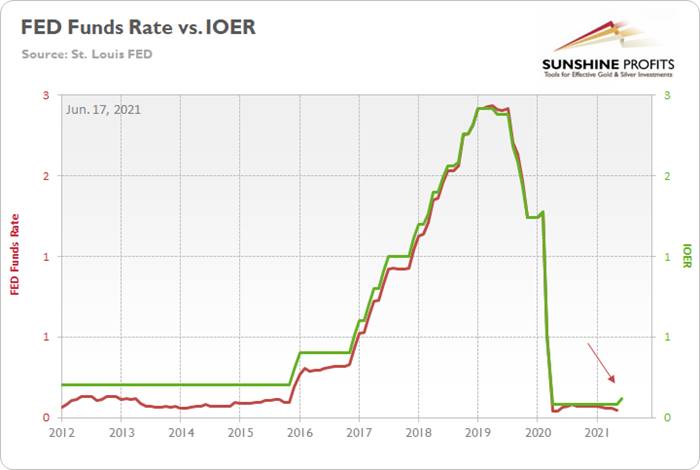
Toexplain, the red line above tracks the U.S. federal funds rate, while the greenline above tracks the IOER. If you analyze the behavior, you can see that thetwo have a rather close connection. And while we don’t expect the FED to raiseinterest rates anytime soon, officials’ words, actions and the macroeconomicdata signal that the taper is likely coming in September.
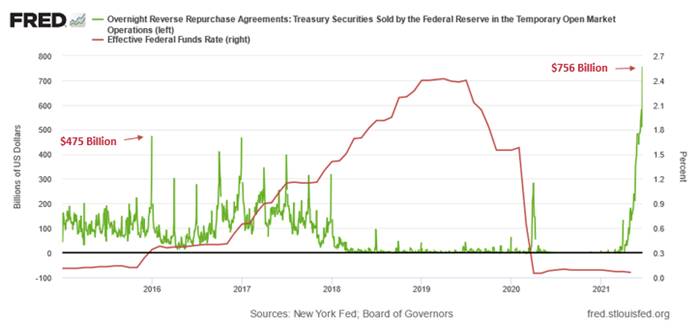
And in an ironic twist, while thequestion of whether it will or whether itwon’t seemed reasonable at the time, the tsunami of reverse repurchaseagreements on Jun. 17 signal that 0.15% just isn’t going to cut it. Case inpoint: while the FED hoped that the five-basis-point olive branch would calminstitutions’ nerves, a record $756billion in excess liquidly was shipped to the FED on Jun. 17 . For context,it was nearly $235 billion more than the daily amount recorded on Jun. 16.
Please see below:
To explain the significance, I wrotepreviously:
Areverse repurchase agreement (repo) occurs when an institution offloads cash tothe FED in exchange for a Treasury security (on an overnight or short-termbasis). And with U.S. financial institutions currently flooded with excessliquidity, they’re shipping cash to the FED at an alarming rate.
Thegreen line above tracks the daily reverse repo transactions executed by theFED, while the red line above tracks the U.S. federal funds rate. Moreover, notice what happened the last time reverse repos moved above 400billion? If you focus yourattention on the red line, you can see that after the $400 billion level wasbreached in December 2015, the FED’s rate-hike cycle began. Thus, with currentinflation dwarfing 2015 levels and U.S. banks practically throwing cash at theFED, is this time really different?
Furthermore, I noted on Jun. 17 that theFED’s latest ‘dot plot’ was a hawkish shift that market participants were notexpecting.
I wrote:
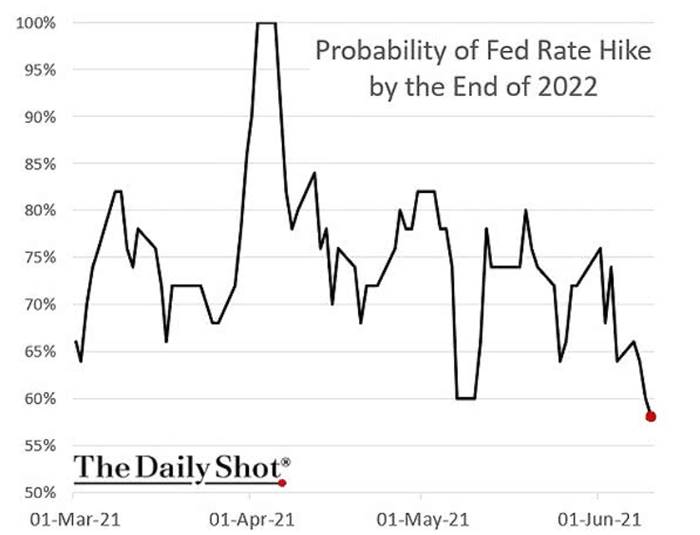
Theperceived probability of a rate hike by the end of 2022 sunk to a 2021 low onJun. 12. However, after the FED’s material about-face on Jun. 16, I’m surethese positions have been recalibrated.
Pleasesee below:
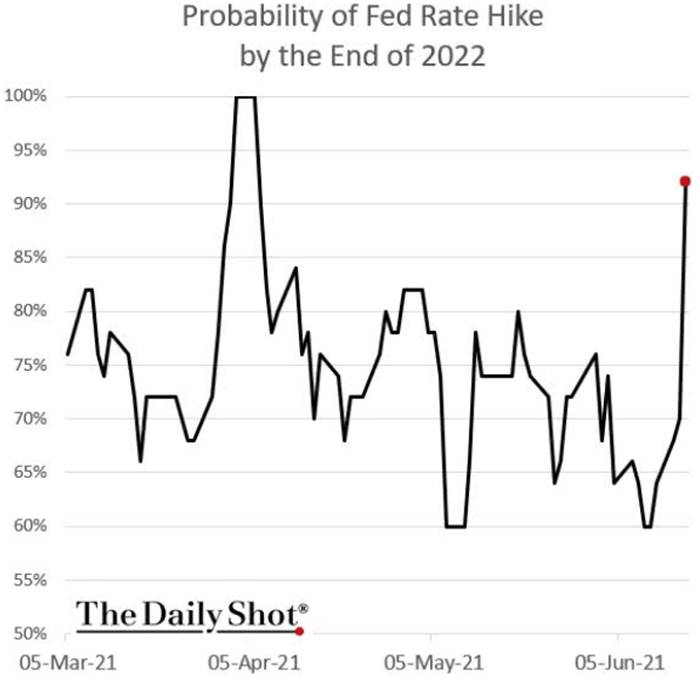
And as if the chart above had beeninverted, the perceived probability of a rate hike by the end of 2022 has nowsurged to more than 90%.
TheDeath Toll of June 17th
In addition, while I’ve been warning formonths that the bond market’s fury would eventually upend the PMs, not only has the FED’sinflationary misstep rattled the financial markets, but the U.S. 30-yearfixed-rate mortgage (FRM) jumped to 3.25% on Jun. 17.
Please see below:
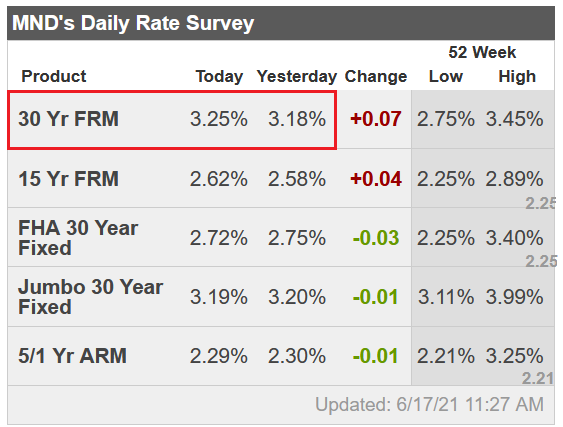
Source:Mortgage News Daily
Furthermore, please read what MatthewGraham, COO of Mortgage News Daily, had to say:
“Markets were somewhat surprised by theFed's rate hike outlook. Granted, the Fed Funds Rate (the thing the Fed wouldactually be hiking) doesn't control mortgage rates, but the outlook speaks to how quickly the Fed would need to dial back itsbond buying programs (aka "tapering"). Those programs definitelyhelp keep rates low. The sooner the Fed begins tapering, the soonermortgage rates will see some upward pressure .”
To that point, with tapering propheciesofficially morphing from the minority into the consensus, the PMs weren’t theonly commodities sent to slaughter on Jun. 17. For example, the S&P GoldmanSachs Commodity Index (S&P GSCI) plunged by 2.37% as the inflationaryunwind spread. For context, the S&P GSCI contains 24 commodities from allsectors: six energy products, five industrial metals, eight agriculturalproducts, three livestock products and two precious metals.
Exacerbating the selling pressure,China’s National Food and Strategic Reserves Administration announced on Jun.17 that it would release its copper, aluminum and zinc supplies “in the nearfuture” in a bid to contain the inflationary surge that’s plaguing the region.As a result, if the psychological forces that led to the surge in cost-pushinflation come undone, the USD Index could move from the outhouse to thepenthouse.
To explain, I wrote on Apr. 27:
Whyis the behavior of the S&P GSCI so important? Well, if you analyze thechart below, you can see that the S&P GSCI’s pain is often the USD Index’sgain. 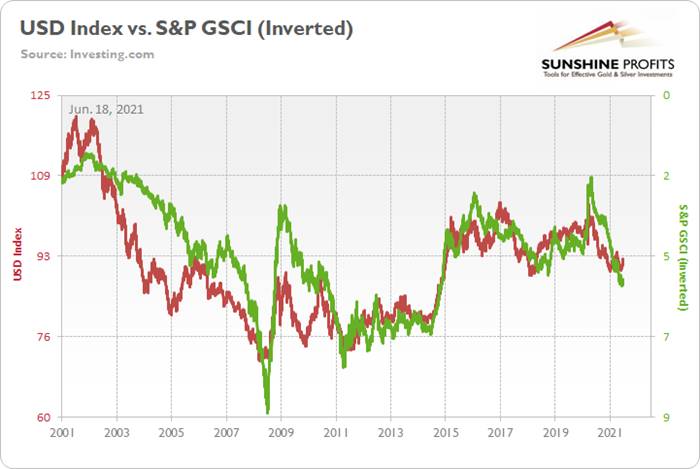
Toexplain, the red line above tracks the USD Index, while the green line abovetracks the inverted S&P GSCI. For context, inverted means that the S&P GSCI’s scaleis flipped upside down and that a rising green line represents a fallingS&P GSCI, while a falling green line represents a rising S&P GSCI. Moreimportantly, though, since 2010, it’s been a near splitting image.
InflationIs Still There
In the meantime, though, inflationarypressures are far from contained. And while the S&P GSCI’s plight would bea boon for the USD Index, the greenback still has plenty of other bullets inits chamber. Case in point: with the FED poised to taper in September andinvestors underpricing the relative outperformance of the U.S. economy, VANDAResearch’s latest FX Outlook signals that over-optimism abroad could lead to amaterial re-rating over the summer.
Please see below: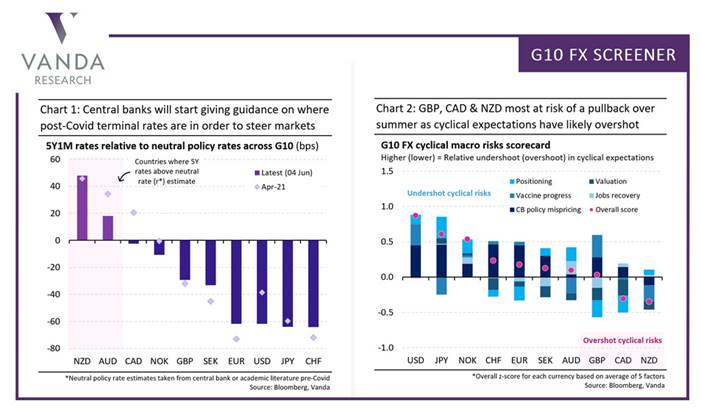
To explain, the chart on the rightdepicts investors’ expectations of economic strength across various regions. Ifyou analyze the second (CAD) and the third (GBP) bars from the right, you cansee that positioning is more optimistic than the economic growth that’s likelyto materialize. Conversely, if you analyze the first bar (USD) from the left,you can see that positioning is more pessimistic than the economic growththat’s likely to materialize. As a result, with U.S. GDP growth poised tooutperform the U.K., Canada, and the Eurozone, an upward re-rating of the USDIndex could intensify the PMs selling pressure over the medium term.
On top of that, while the inflation storyis far from over (and will pressure the FED to taper in September), thePhiladelphia FED released its Manufacturing Business Outlook Survey on Jun. 17.And while manufacturing activity dipped in June, “the diffusion index forfuture general activity increased 17 points from its May reading, reaching69.2, its highest level in nearly 30years .”
In addition, “the employment indexincreased 11 points, recovering its losses from last month,” and “the futureemployment index rose 2 points … [as] over 59 percent of the firms expect toincrease employment in their manufacturing plants over the next six months,compared with only 5% that anticipates employment declines.” For context,employment is extremely important because a strengthening U.S. labor marketwill likely put the final nail in QE’s coffin.
But saving the best for last:
“The prices paid diffusion index rose forthe second consecutive month, 4 points to 80.7, its highest reading since June 1979 . The percentage of firms reportingincreases in input prices (82 percent) was higher than the percentage reportingdecreases (1 percent). The current prices received index rose for the fourthconsecutive month, moving up 9 points to 49.7, its highest reading since October 1980 .”
Please see below: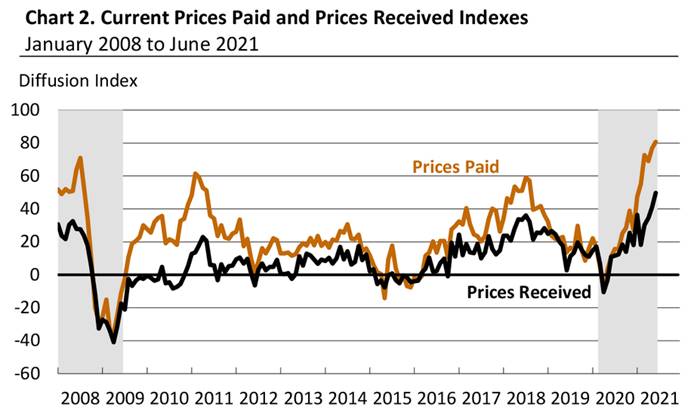
Source:Philadelphia FED
InvestmentClock Is Ticking
Also, signaling that QE is living onborrowed time, Bank of America’s ‘Investment Clock’ is ticking toward a bearflattener in the second half of 2021. For context, the term implies thatshort-term interest rates will rise at a faster pace than long-term interestrates and result in a ‘flattening’ of the U.S. yield curve.
Please see below: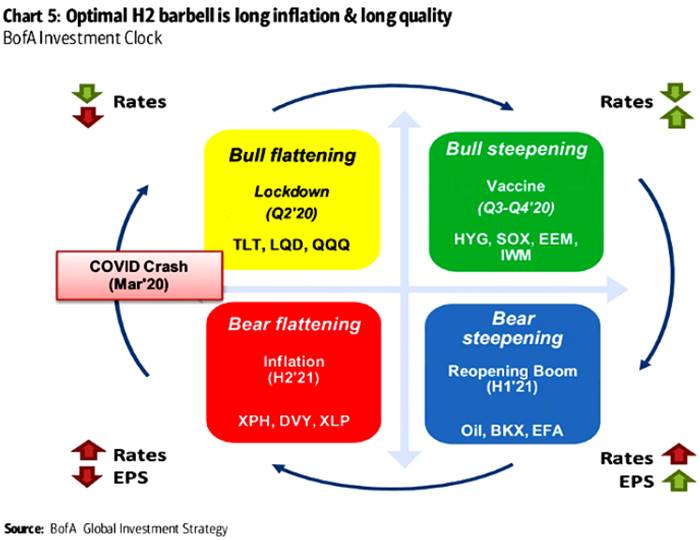
To explain, the circular reference abovedepicts the appropriate positioning during various stages of the economiccycle. If you focus your attention on the red box, you can see that BofAforecasts higher interest rates and lower earnings per share (EPS) for S&P500 companies during the back half of the year.
As further evidence, not only is theFED’s faucet likely to creak in the coming months, but fiscal stimulus may benearing the dry season as well.
Please see below: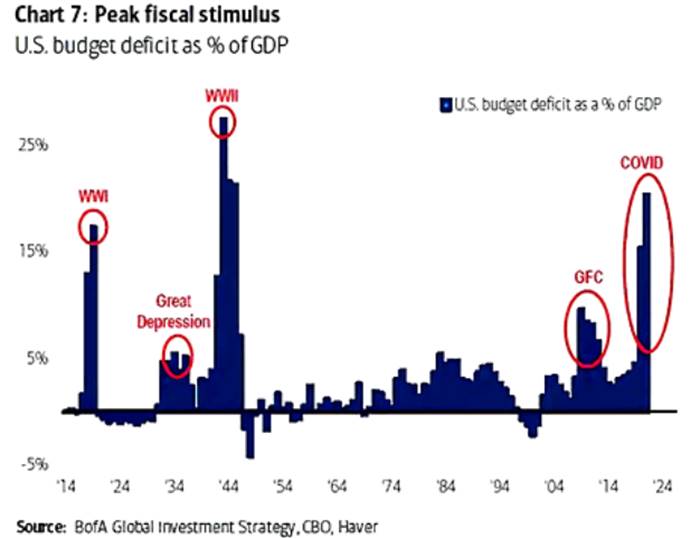
To explain, the blue bars above track theU.S. budget deficit as a percentage of the GDP. If you analyze the red circleon the right side of the chart, you can see that coronavirus-induced spendingwas only superseded by World War Two. Moreover, with the law of gravityimplying that ‘what goes up must come down,’ the forthcoming infrastructurepackage could be investors’ final fiscal withdrawal.
TheHousing Market
Last but not least, while the S&P 500has remained relatively upbeat in recent days, weakness in the U.S. housingmarket could shift the narrative over the medium term.
Please see below: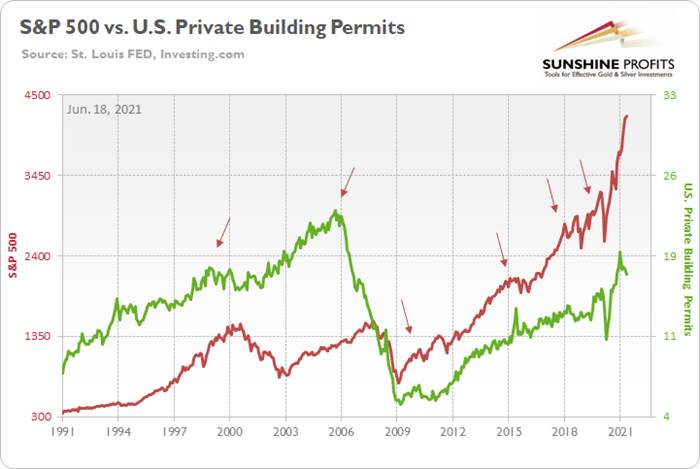
To explain, the red line above tracks theS&P 500, while the green line above tracks U.S. private building permits(released on Jun. 16). If you analyze the arrows, you can see that the former nearly always rolls over inadvance of the latter . For context, the S&P 500 initially peakedbefore building permits in 2018 and alongside in 2015. However, in 2018, whenthe S&P 500 recovered and continued its ascent – while building permits didnot – the U.S. equity benchmark suffered a roughly 20% drawdown. Thus, if youanalyze the right side of the chart, you can see that building permits peakedin January and have declined significantly. And if history is any indication,the S&P 500 will eventually follow suit.
In conclusion, the PMs imploded on Jun.17, as taper trepidation and the USD Index’s sharp re-rating dropped theguillotine on the metals. And with the FED’s latest ‘dot plot’ akin to bulletholes in the PMs, the walking wounded is still far from a recovery. Withinflation surging and the FED likely to become even more hawkish in the comingmonths, the cycle has materially shifted from the goldilocks environment thatthe metals once enjoyed. And with the two-day price action likely the openingact of a much larger play, the PMs could be waiting months for another round ofapplause.
Today's article is asmall sample of what our subscribers enjoy on a daily basis. They know aboutboth the market changes and our trading position changes exactly when theyhappen. Apart from the above, we've also shared with them the detailed analysisof the miners and the USD Index outlook. Check more of our free articles on our website, including this one – justdrop by and have a look. Weencourage you to sign up for our daily newsletter, too - it's free and if youdon't like it, you can unsubscribe with just 2 clicks. You'll also get 7 daysof free access to our premium daily Gold & Silver Trading Alerts to get ataste of all our care. Signup for the free newsletter today!
Thank you.
Przemyslaw Radomski, CFA
Founder, Editor-in-chief
Toolsfor Effective Gold & Silver Investments - SunshineProfits.com
Tools für EffektivesGold- und Silber-Investment - SunshineProfits.DE
* * * * *
About Sunshine Profits
SunshineProfits enables anyone to forecast market changes with a level of accuracy thatwas once only available to closed-door institutions. It provides free trialaccess to its best investment tools (including lists of best gold stocks and best silver stocks),proprietary gold & silver indicators, buy & sell signals, weekly newsletter, and more. Seeing is believing.
Disclaimer
All essays, research and information found aboverepresent analyses and opinions of Przemyslaw Radomski, CFA and SunshineProfits' associates only. As such, it may prove wrong and be a subject tochange without notice. Opinions and analyses were based on data available toauthors of respective essays at the time of writing. Although the informationprovided above is based on careful research and sources that are believed to beaccurate, Przemyslaw Radomski, CFA and his associates do not guarantee theaccuracy or thoroughness of the data or information reported. The opinionspublished above are neither an offer nor a recommendation to purchase or sell anysecurities. Mr. Radomski is not a Registered Securities Advisor. By readingPrzemyslaw Radomski's, CFA reports you fully agree that he will not be heldresponsible or liable for any decisions you make regarding any informationprovided in these reports. Investing, trading and speculation in any financialmarkets may involve high risk of loss. Przemyslaw Radomski, CFA, SunshineProfits' employees and affiliates as well as members of their families may havea short or long position in any securities, including those mentioned in any ofthe reports or essays, and may make additional purchases and/or sales of thosesecurities without notice.
Przemyslaw Radomski Archive |
© 2005-2019 http://www.MarketOracle.co.uk - The Market Oracle is a FREE Daily Financial Markets Analysis & Forecasting online publication.