Gold: The Past Years Are Often the Best Guides / Commodities / Gold and Silver 2021

As we know, history tends to rhyme.It’s never the same, but when you zoom out, the bigger picture often looks verysimilar. What does it mean for gold?
Short-termimplications
With gold’s back-and-forth price actionmirroring its behavior from 2012, the yellow metal is likely destined fordevaluation.
Back then, gold zigzagged with anxietybefore suffering a material drawdown. In fact, in early October 2012, it movedslightly above the initial highs right before sliding.
Moreover, while the yellow metal hasbounced above its declining resistance line (the black line below), the priceaction mirrors gold’s behavior from early January. If you analyze the blue linebelow, you can see that investors’ optimism regarding gold’s short-termbreakout quickly faded and the yellow metal sunk like a stone. In addition,with gold’s RSI (Relative Strength Index) moving slightly above 70 before theJanuary swoon occurred, an identical development is already playing out in realtime.
Gold seems to be insisting on repeating –to some extent – its 2012 performance, and – to some extent – its 2008performance. Either way, it seems that gold is about to slide.
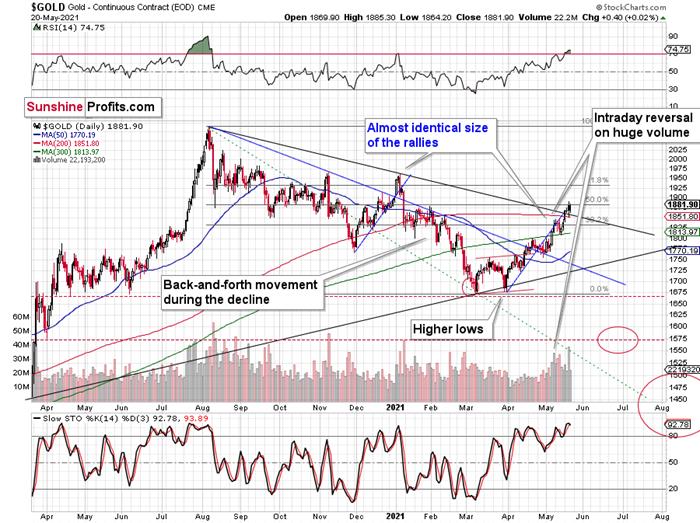
The reversal in gold took place aftergold moved very close to its mid-January highs and the 50% Fibonacciretracement based on the August 2020 – March 2021 decline.
The sizes of the current rally (takingthe second March bottom as the starting point) and the rally that ended at thebeginning of this year are practically identical at the moment.
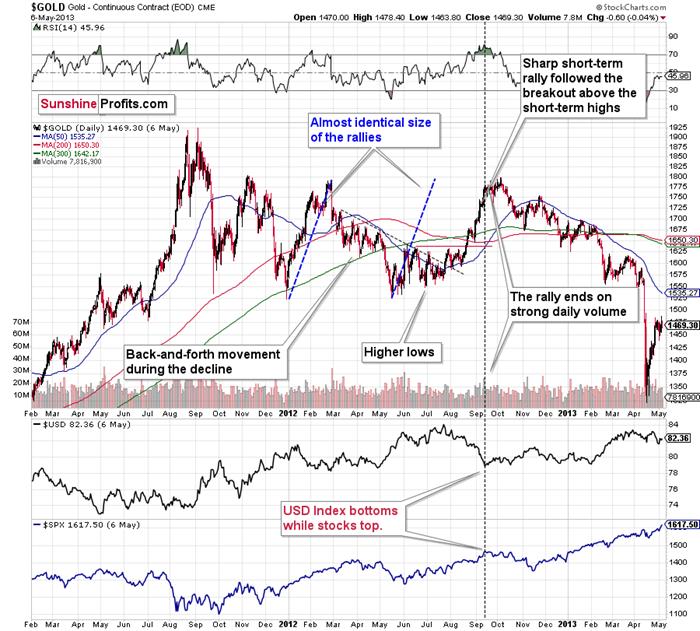
Just as the rallies from early 2012 and late 2012 (marked with blue) were almost identical, thesame could happen now.
The March 2021 low formed well below theprevious low, but as far as other things are concerned, the current situationis similar to what happened in 2012.
The relatively broad bottom with higherlows is what preceded both final short-term rallies – the current one, and the2012 one. Their shape as well as the shape of the decline that preceded thesebroad bottoms is very similar. In both cases, the preceding decline had someback-and-forth trading in its middle, and the final rally picked up pace afterbreaking above the initial short-term high.
Interestingly,the 2012 rally ended on huge volume, which is exactly what we saw also on May19 this year. Consequently, forecastingmuch higher gold prices here doesn’t seem to be justified based on thehistorical analogies.
The lower part of the above chart showshow the USD Index and the general stock market performed when gold ended itslate-2012 rally and was starting its epic decline. In short, that was when theUSD Index bottomed, and when the general stock market topped.
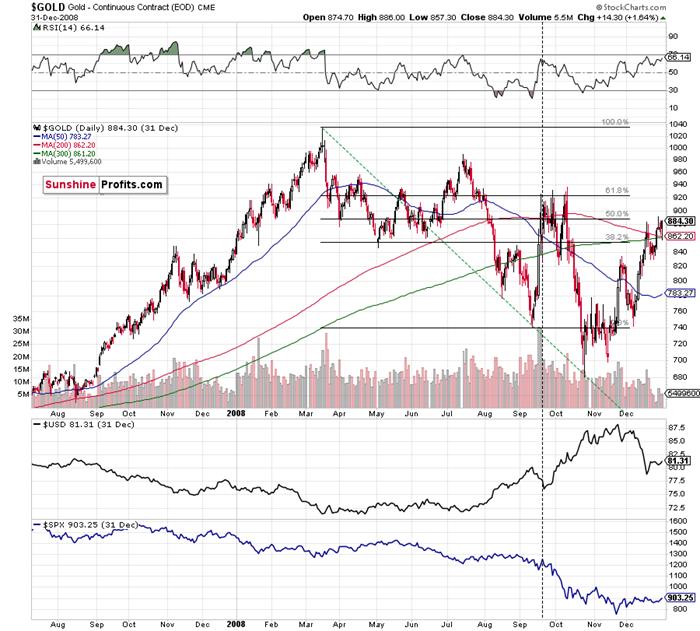
Back in 2008, gold corrected to 61.8%Fibonacci retracement, but it stopped rallying approximately when the USD Indexstarted to rally, and the general stock market accelerated its decline. Thistime the rally was not as volatile, so the lower – 50% Fibonacci retracementlevel will hold the rally in check.
Taking into consideration that thegeneral stock market has probably just topped and the USD Index is about torally, then gold is likely to slide for the final time in the followingweeks/months. Both above-mentioned markets support this bearish scenario and sodo the self-similar patterns in terms of gold price itself.
MACDand the Long Term
Approaching the subject from a differentside, remember the huge gap between the U.S. 10-Year Treasury yield and theU.S. 10-Year breakeven inflation rate? The situation in the very long-term MACDindicator is yet another confirmation that what we saw recently is similar towhat we saw before the huge 2012 – 2013 slide. We get the same confirmationfrom the gold to bonds ratio, and I’ll move to that a bit later.
With February’s monthly close the lastpiece of the puzzle, the MACD indicator’s sell-signal is now perfectly clear. If you analyze the chart below(at the bottom right), you can see that the MACD line has crossed the signalline from above – a development that preceded significant drawdowns in 2008 and2011.
Based on gold’s previous performanceafter the major sell signals from the MACD indicator, one could now expect goldto bottom in the ~$1,200 to ~1,350 range. Given the price moves that wewitnessed in 1988, 2008 and 2011, historical precedent implies gold forming abottom in this range. However, due to the competing impact of several differentvariables, it’s possible that the yellow metal could receive the key support ata higher level.
Only a shade below the 2011 high, today’sMACD reading is still the second-highest reading in the last 40 years. Moreimportantly though, if you analyze the chart below (the red arrows at thebottom), the last four times the black line cut through the red line from above,a significant drawdown occurred.
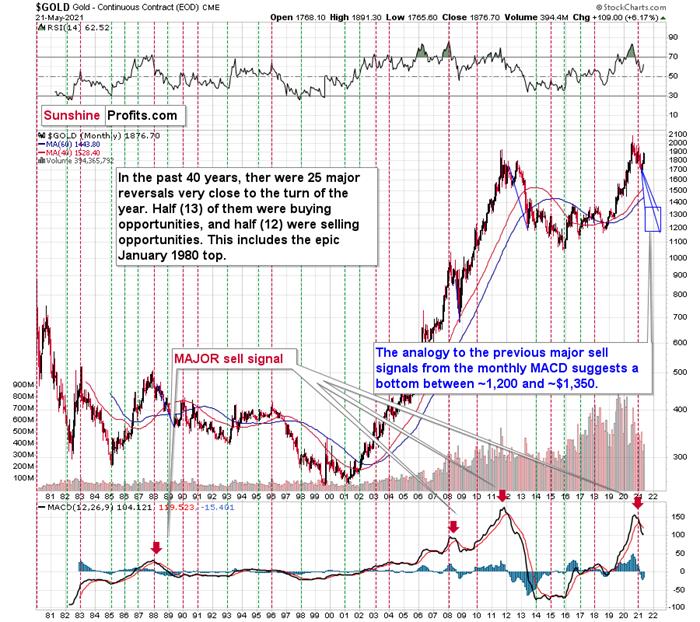
Also ominous is that the magnitude of thedrawdowns in price tend to coincide with the magnitude of the precedingupswings in MACD. And with today’s reading only surpassed by 2011, a climacticmove to the $1,250/$1,450 range isn’t out of the question for gold. The aboveis based on how low gold had previously declined after a similarly importantsell signal from the MACD
Now, the month is not over yet, so onemight say that it’s too early to consider the sell signal that’s based on monthly closing prices , but it seemsthat given the level that the MACD had previously reached and the shape of thetop in the black line, it makes the situation so similar to 2011/2012 that thesell signal itself is just a cherry on the bearish analytical cake.
Considering the reliability of the MACDindicator a sell signal for major declines, the reading also implies that gold’sdowntrend could last longer and be more severe than originally thought. Asa result, $1,500 remains the most likely outcome, with $1,350 still in thecards.
As further evidence, if you focus yourattention on the monthly price action in 2008, you can see that gold isbehaving exactly as it did before it suffered a significant decline.
Please see below:
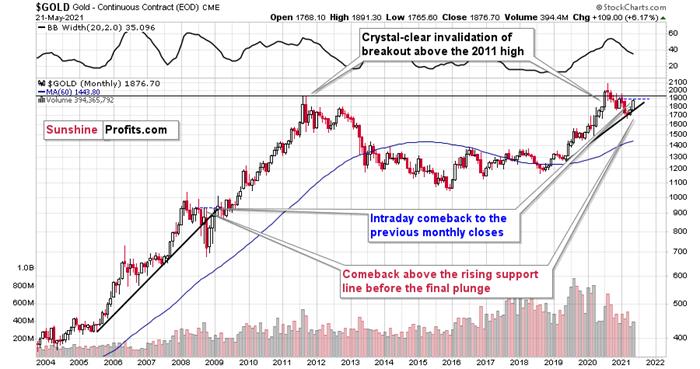
To explain, after making a new all-time high in 2008 (that was a breakout abovethe 1980 tops), gold declined back to its rising support line before recordinga short-term corrective upswing. This upswing ended approximately at gold’sprevious monthly closing price. I marked it with a horizontal, blue, dashedline.
Similarly, if you analyze the right sideof the chart, you can see that an identical pattern has emerged. With gold’scorrective upswing following a reconnection with its rising support line,history implies that a sharp decline should occur in the coming months and thatthe reversal is at hand or already behind us. After all, the thing thattriggered the decline almost a year ago was the fact that gold made a new all-time high . Moreover,the recent high was very close to the previous high in terms of the monthlyclosing prices (Dec. 2020 - $1,895.10 vs. the recent intraday high of$1,891.30).
Whatabout the HUI Index?
Not only are ominous signs emerging fromgold’s medium-and-long-term charts, but beneath the surface, the gold minersare also folding their hands. If you analyze the chart below, you can see thatthe HUI Index back-and-forth price action mirrors its behavior from 2008 and2012 and its bearish head & shoulders pattern is also gaining similarity.In addition, the BUGS (after all, HUI is called the GoldBugs Index) stochastic oscillator has moved all-in like the 2012 analogue(depicted at the bottom part of the chart below), and thus, it seems to be onlya matter of time before the HUI Index completely blows its bankroll.
Please see below:

To explain, the HUI Index retraced a bitmore than 61.8% of its downswing in 2008 and in between 50% and 61.8% of itsdownswing in 2012 before eventually rolling over. And with investors rejectingthe HUI’s recent attempt to break above the 61.8% level, the house of cards is slowlycoming down.
The bottom line?
If the HUI Index hasn’t already peaked,history implies that a top is increasingly imminent. As a result, in myopinion, now is the time to enter short positions and not exit them.
Now, in both (2008 and 2012) cases, the final top – the right shoulder – formedclose to the price where the left shoulder topped. And in early 2020, the leftshoulder topped at 303.02.
That’s why Ipreviously wrote that “it wouldn’t be surprising to see a move to about 300in the HUI Index”. And that’s exactly what we saw (a move above 320 is stillclose to 300 from the long-term point of view). To clarify, onehead-and-shoulders pattern – with a rising neckline – was already completed,and one head-and-shoulders pattern – with a horizontal neckline – is beingcompleted, but we’ll have the confirmation once miners break to new yearlylows.
In addition, the recent rally is not a game-changer, but rather a partof a long-term pattern that’s not visible when one focuses on the short termonly.
The thing is that the vast majority ofindividual investors and – sadly – quite many analysts focus on the trees whileforgetting about the forest. During the walk, this might result in gettinglost, and the implications are no different in the investment landscape.
Thank you for reading our free analysistoday. Please note that the above is just a small fraction of today’sall-encompassing Gold & Silver Trading Alert. The latter includes multiplepremium details such as the target for gold that could be reached in the nextfew weeks. If you’d like to read those premium details, we have good news foryou. As soon as you sign up for our free gold newsletter, you’ll get a free7-day no-obligation trial access to our premium Gold & Silver TradingAlerts. It’s really free – sign up today.
Przemyslaw Radomski, CFA
Founder, Editor-in-chief
Toolsfor Effective Gold & Silver Investments - SunshineProfits.com
Tools für EffektivesGold- und Silber-Investment - SunshineProfits.DE
* * * * *
About Sunshine Profits
SunshineProfits enables anyone to forecast market changes with a level of accuracy thatwas once only available to closed-door institutions. It provides free trialaccess to its best investment tools (including lists of best gold stocks and best silver stocks),proprietary gold & silver indicators, buy & sell signals, weekly newsletter, and more. Seeing is believing.
Disclaimer
All essays, research and information found aboverepresent analyses and opinions of Przemyslaw Radomski, CFA and SunshineProfits' associates only. As such, it may prove wrong and be a subject tochange without notice. Opinions and analyses were based on data available toauthors of respective essays at the time of writing. Although the informationprovided above is based on careful research and sources that are believed to beaccurate, Przemyslaw Radomski, CFA and his associates do not guarantee theaccuracy or thoroughness of the data or information reported. The opinionspublished above are neither an offer nor a recommendation to purchase or sell anysecurities. Mr. Radomski is not a Registered Securities Advisor. By readingPrzemyslaw Radomski's, CFA reports you fully agree that he will not be heldresponsible or liable for any decisions you make regarding any informationprovided in these reports. Investing, trading and speculation in any financialmarkets may involve high risk of loss. Przemyslaw Radomski, CFA, SunshineProfits' employees and affiliates as well as members of their families may havea short or long position in any securities, including those mentioned in any ofthe reports or essays, and may make additional purchases and/or sales of thosesecurities without notice.
Przemyslaw Radomski Archive |
© 2005-2019 http://www.MarketOracle.co.uk - The Market Oracle is a FREE Daily Financial Markets Analysis & Forecasting online publication.