Gold: The Tapering Clock Is Ticking / Commodities / Gold and Silver 2021

With the FED increasingly hawkish andthe USDX rising from the ashes, don’t be fooled by the recent upswing in gold.The bears are getting ready.
With the reflation trade getting cut offat the knees, the only asset class not feeling the pain is U.S. equities.However, while shorts capitulate and send the U.S. 10-Year Treasury higher (andthe yield lower), the flattening of the U.S. yield curve screams of a potentialrecession. However, while the development is bullish for the USD Index andbearish for the PMs, investors areputting the cart before the horse.
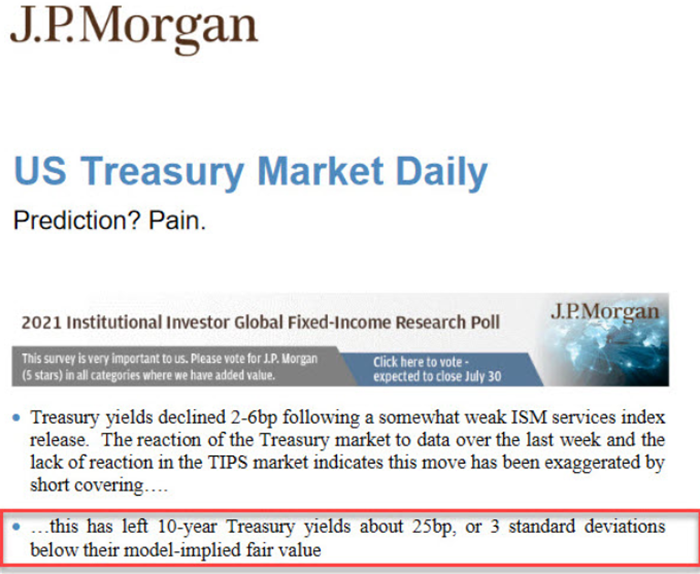
To explain, while the U.S. 10-YearTreasury yield languishes in its depressed state, J.P. Morgan told clients onJul. 6 that the Treasury benchmark is roughly three standard deviations belowits model-implied fair value. For context, J.P. Morgan believes that the U.S.10-Year Treasury yield should trade at roughly 1.60%, and, given thethree-sigma underperformance, standard normal probabilities imply a roughly99.9% chance that the Treasury benchmark will move higher over the medium term.
br>Please see below:
However, while the bond market ‘wantswhat it wants’, it’s important to remember that a flattening of the U.S. yield curve has the same effect on the PMs. For example, while I’ve been warning for months that the U.S. Federal Reserve(FED) will likely taper its asset purchases much sooner than investors expect,the minority view is now the consensus. And with that, the hawkish shiftreduces inflation expectations, reduces growth expectations and often resultsin lower long-term interest rates. However, while the U.S. 10-Year Treasuryyield still remains significantly undervalued in our view, ‘the ghost oftapering past’ has investors aiming to front-run a September reveal.
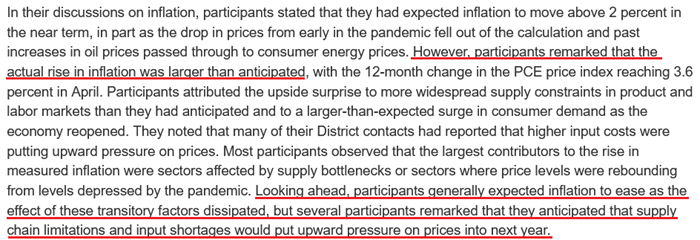
As evidence, the FED released the minutesfrom its Jun. 15/16 policy meeting on Jul. 7. An excerpt from the report read:
“Various participants mentioned that theyexpected the conditions for beginning to reduce the pace of asset purchases tobe met somewhat earlier than they hadanticipated at previous meetings in light of in-coming data.”
And surprise, surprise, while I’ve beenwarning for some time that surging inflation will likely force the FED’s hand,the report revealed:
Source: U.S. FED
TheContainer War
But with long-term yields signaling the deathof inflation, is a regime shift already underway? Well, I warned previouslythat inflationary pressures are unlikely to abate anytime soon:
I wrote:
Withthe U.S. Census Bureau revealing on Jun. 8 that U.S. imports from China (goods)totaled nearly $38 billion in April, more and more data signals that the U.S.economy will continue to feel the inflationary burn. Shipping costs are alsoexploding at an unprecedented rate.
Pleasesee below: 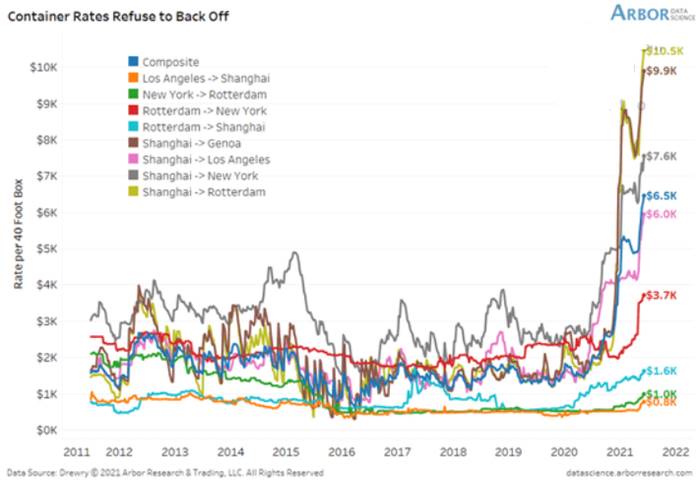
Toexplain, the lines above track the shipping costs to-and-from various regions.If you analyze the dark blue line sandwiched in the middle ($6.5K), averageshipping costs continue to skyrocket. Moreover, if you’re shipping fromShanghai to Rotterdam, New York or Genca, global businesses are nowhere nearsolving these “transitory” issues.
Andproviding another update on Jun. 28, thesituation has only worsened.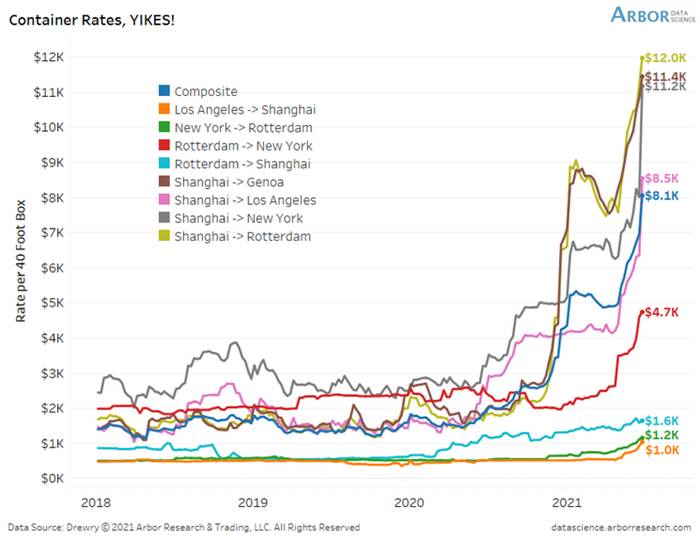
Toexplain, if you compare the first chart to the one directly above, you can seethat the composite container rate (the dark blue line) has increased from $6.5K to $8.1K in only two weeks. What’s more, shipping from Shanghai toRotterdam (the gold line) has increased from $10.5K to $12.0k, while Shanghaito New York (the gray line) has risen from $7.6K to $11.2K. As a result, doesit seem like inflationary pressures are a thing of the past?
To that point, with the old adageimplying that ‘the third time’s the charm,’ the surge lives on.
Please see below: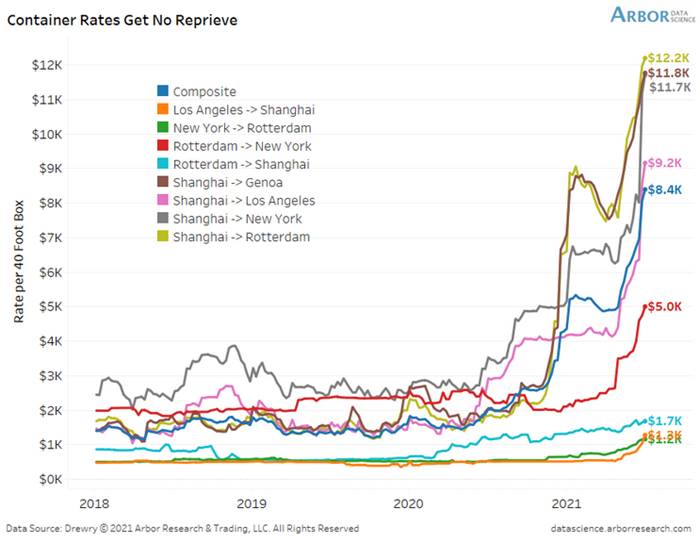
To explain, the composite container rate has now gone from $6.5K through $8.1K to$8.4K in less than a month. And with shipping costs from China (Shanghai)leading the charge, the FED’s “transitory” narrative still lacks empiricalcredibility.
To that point, can you guess whichtrading partner accounts for 17.3% of U.S. imports?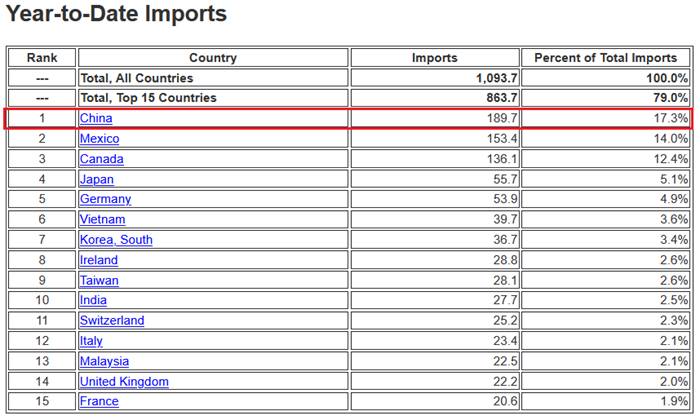
Source: U.S. Census Bureau
The bottom line? While the bond marketmay ‘wish upon a star,’ inflationary pressures are unlikely to subside untilthe FED tapers its asset purchases (and/or raises interest rates).
WhatCan the Services PMI Tell Us?
As further evidence, the Institute forSupply Management (ISM) released its services PMI on Jul. 6. And while theheadline index declined from 64 in May (an all-time high) to 60.1 in June,inflation remained abundant:
“Prices paid by service organizations formaterials and services increased in June, with the index registering 79.5percent, 1.1 percentage points lower than May’s reading of 80.6 percent. 17services industries reported an increase in prices paid during the month ofJune … [with] only [one] industry reporting a decrease.”
In addition, ISM Chair Anthony Nievesadded:
“According to the Services PMI, 16services industries [out of 18] reported growth. The composite index indicatedgrowth for the 13th consecutive month after a two-month contraction in Apriland May 2020. The rate of expansion in the services sector remains strong,despite the slight pullback in the rate of growth from the previous month’sall-time high. Challenges with materials shortages, inflation, logistics andemployment resources continue to be an impediment to business conditions.”
For context, the ISM requires writtenpermission before redistributing any of its content, and that’s why I quotedthe findings rather than including a screenshot of the report. However, if youwant to review the source material, you can find it here.
Likewise, IHS Markit also released itsU.S. services PMI on Jul. 6. An excerpt from the report read:
“Contributing to the robust rise inactivity across the service sector was a further marked increase in newbusiness at the end of the second quarter. Alongside strong customer demand,firms attributed the upturn in new sales to the acquisition of new clients.Although the rate of new business growth slipped to a three-month low, it wasstill the third-fastest on record.”
And following right along: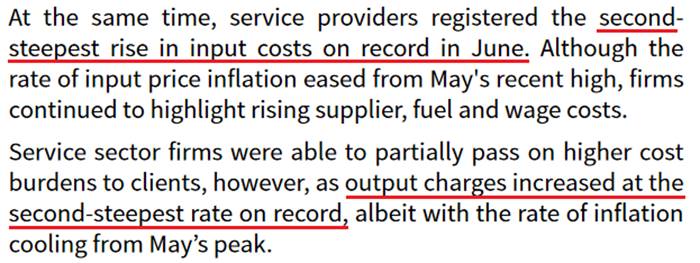
Source: IHS Markit
Furthermore, while oil prices have surgedin 2021 so far, major companies haven’t increased their capital investments. Asa result, not only are U.S. crude oil inventories still ~6% below theirhistorical average (as of Jun. 30), but dormant supply could put upwardpressure on prices in the coming months.
Please see below: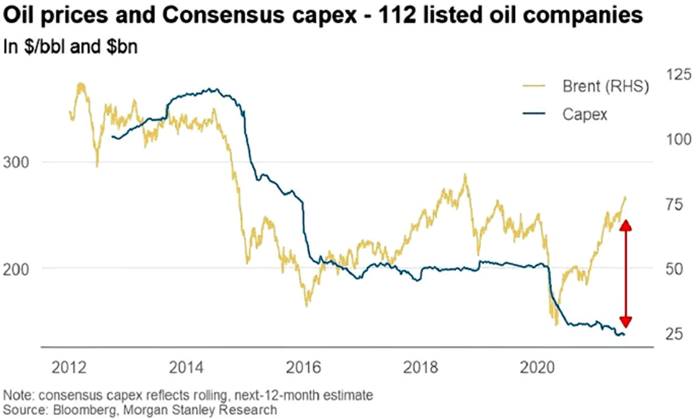
To explain, the gold line above tracksthe Brent price, while the blue line above tracks major oil companies’ capitalexpenditures. If you analyze the right side of the chart, you can see thatinvestments in drilling infrastructure have fallen off a cliff. And with demandlikely to remain abundant as economies reopen, fuel, gasoline and heating oilprices will likely remain elevated.
TheSwagger of the USDX
Finally, with the USD Index regaining itsswagger and the EUR/USD falling from grace, the cocktail of a hawkish FED andfundamental underperformance is weighing heavily on the euro. Moreover, withgrowth differentials poised to widen in the coming months, U.S. dollar strengthcould cast a dark shadow over the PMs.
Please see below: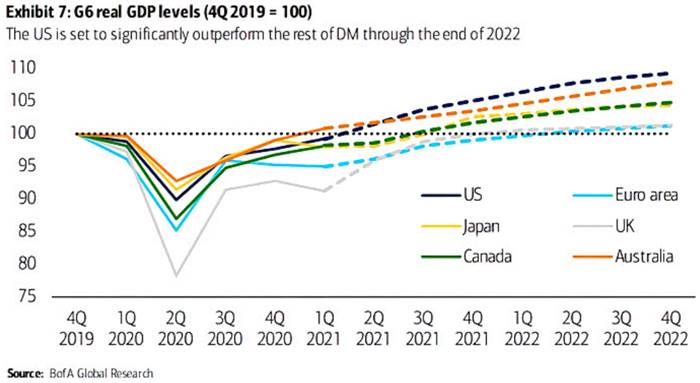
To explain, the various lines above trackBank of America’s quarterly projections for G6 real GDP levels. If you focusyour attention on the dark blue (U.S.) and light blue (Eurozone) lines, you cansee that the former is leading the pack, while the latter is vying for the lastplace. On top of that, the U.S.’s projected outperformance of Japan, Canada,and the U.K. is bullish for the USD/JPY and the USD/CAD but bearish for theGBP/USD.
In conclusion, while the PMs remainupbeat, it’s likely another case of ‘been there, done that.’ For example, itwas roughly four months ago that falling real yields helped uplift gold beforeit eventually collapsed. And with a similar event unfolding once again, goldhas demonstrated rational (though, superficial) strength. However, with theclock ticking toward a taper announcement and the USD Index rising from theashes, the corrective upswing is likely another head fake within gold’s medium-termdowntrend.
Today's article is asmall sample of what our subscribers enjoy on a daily basis. They know aboutboth the market changes and our trading position changes exactly when theyhappen. Apart from the above, we've also shared with them the detailed analysisof the miners and the USD Index outlook. Check more of our free articles on our website, including this one – justdrop by and have a look. Weencourage you to sign up for our daily newsletter, too - it's free and if youdon't like it, you can unsubscribe with just 2 clicks. You'll also get 7 daysof free access to our premium daily Gold & Silver Trading Alerts to get ataste of all our care. Signup for the free newsletter today!
Thank you.
Przemyslaw Radomski, CFA
Founder, Editor-in-chief
Toolsfor Effective Gold & Silver Investments - SunshineProfits.com
Tools für EffektivesGold- und Silber-Investment - SunshineProfits.DE
* * * * *
About Sunshine Profits
SunshineProfits enables anyone to forecast market changes with a level of accuracy thatwas once only available to closed-door institutions. It provides free trialaccess to its best investment tools (including lists of best gold stocks and best silver stocks),proprietary gold & silver indicators, buy & sell signals, weekly newsletter, and more. Seeing is believing.
Disclaimer
All essays, research and information found aboverepresent analyses and opinions of Przemyslaw Radomski, CFA and SunshineProfits' associates only. As such, it may prove wrong and be a subject tochange without notice. Opinions and analyses were based on data available toauthors of respective essays at the time of writing. Although the informationprovided above is based on careful research and sources that are believed to beaccurate, Przemyslaw Radomski, CFA and his associates do not guarantee theaccuracy or thoroughness of the data or information reported. The opinionspublished above are neither an offer nor a recommendation to purchase or sell anysecurities. Mr. Radomski is not a Registered Securities Advisor. By readingPrzemyslaw Radomski's, CFA reports you fully agree that he will not be heldresponsible or liable for any decisions you make regarding any informationprovided in these reports. Investing, trading and speculation in any financialmarkets may involve high risk of loss. Przemyslaw Radomski, CFA, SunshineProfits' employees and affiliates as well as members of their families may havea short or long position in any securities, including those mentioned in any ofthe reports or essays, and may make additional purchases and/or sales of thosesecurities without notice.
Przemyslaw Radomski Archive |
© 2005-2019 http://www.MarketOracle.co.uk - The Market Oracle is a FREE Daily Financial Markets Analysis & Forecasting online publication.