Gold To Silver Ratio Breaks Lower
There is a decisive breakdown in the gold to silver ratio, in favor of silver.
The ratio has corresponded with rising silver prices, which were up 3.0% for the week to close at $17.16.
Gold was lower by 0.7% or $10 for the week to close at $1,338.
By Christopher Aaron
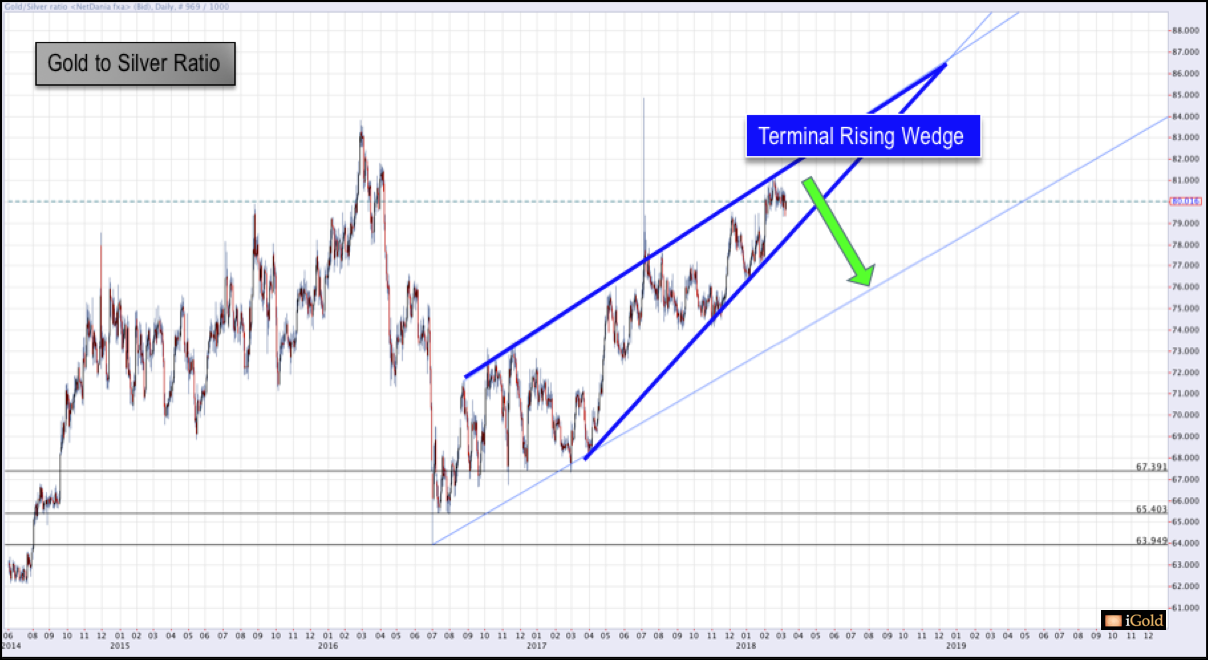
In early March, we proposed that the gold to silver ratio was forming an important topping pattern and that in order for the ongoing precious metals advance to remain healthy, this pattern needed to break lower. The pattern in question was a terminal rising wedge, and it appeared below from the March 12th article:
 (All charts courtesy: http://www.netdania.com)
For new readers, what we are referring to in the chart above is the number of ounces of silver required to purchase one ounce of gold. In general, a rising ratio corresponds with falling precious metals prices, while a falling ratio corresponds with rising precious metals prices. In the article, we stated that although the pattern could remain valid until late-2018 as shown by the blue boundaries, in practicality most terminal rising wedges resolve between 2/3 to 3/4 of the way through their timelines. In other words, we expected a resolution by June at the latest.
Let's fast forward six weeks.
Gold to Silver Ratio Breaks Lower
As of last week, this pattern has indeed resolved lower, and now looks as follows:
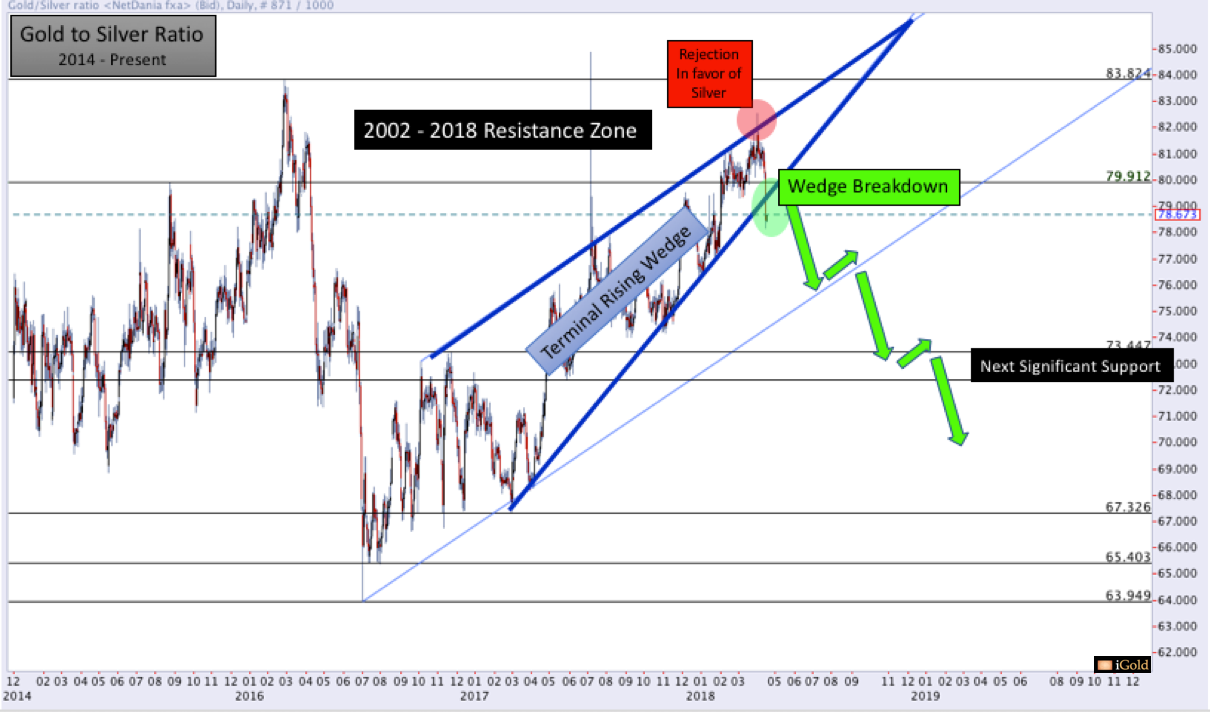 Note the clear slicing through of the lower boundary of the wedge on Wednesday (green callout), as the ratio moved from 80.5 to 78.5 in just one trading day. Specifically, while gold was up only $2 or 0.1% on Wednesday (4/18/2018), silver was up a massive $0.45 or 2.7% in the single session.
This is a decisive breakdown in the gold to silver ratio, in favor of silver. We can see from the price action last week that a move lower in the ratio has corresponded with rising silver prices, which were up 3.0% for the week to close at $17.16. Meanwhile, gold was lower by 0.7% or $10 for the week to close at $1,338 as of Friday (4/20/2018) afternoon.
What is Next for the Gold to Silver Ratio?
As we have stated in recent weeks, these wedge formations tend to represent topping patterns, and thus far this patterns looks quite healthy. However, we must continue to see follow-through in the ratio lower over the coming weeks and months. While it would not be surprising to see the ratio retest the now-broken boundary from the lower side which would come just below 80.0, under no circumstances should the ratio advance above this level as part of the larger move downward.
We must continue to witness silver outpace gold over the coming weeks and months. The ratio has a minor support level at the lower parallel channel (light blue) at 75.0, and below that 72.5 - 73.5 is the next significant horizontal support (black, far right).
In a true precious metals bull market, the gold to silver ratio should not pause at these support levels for more than 1-3 months each, and no higher peaks should be observed as the process unfolds. Thus, we will continue to monitor the ratio closely over the coming months. Anything else will call into question the sustainability of any metals rallies this year and into 2019.
Takeaway on the Gold to Silver Ratio
This week the terminal rising wedge in the gold to silver ratio has indeed broken lower, a healthy sign for both metals; gold and silver. After 1-2 weeks of backing and filling to retest the broken trendline below 80.0, we want to observe the ratio continue lower without hesitation.
Healthy precious metals advances should see both metals rising, with gold initially leading. Healthy precious metals markets should then see a trickle-down effect, as once gold reaches a certain price level, investors who seek greater value should move "down the food chain" to silver. The ratio between these two metals is chartable to alert us to high probability timelines for the most significant moves to come in the sector.
Disclaimer: This article is provided as a third party analysis and does not necessarily matches views of Bullion Exchanges and should not be considered as financial advice in any way.
Disclosure: I/we have no positions in any stocks mentioned, and no plans to initiate any positions within the next 72 hours.
I wrote this article myself, and it expresses my own opinions. I am not receiving compensation for it. I have no business relationship with any company whose stock is mentioned in this article.
Follow Bullion Exchanges and get email alerts