Gold to Silver Ratio's Breakout - Like a Hot Knife Through Butter / Commodities / Gold & Silver 2020

In yesterday’sfree analysis, we explained why a short-term corrective upswing inthe S&P 500 was likely just around the corner. In today’s article, we’lldiscuss how it’s likely to impact our silverprice forecast. We’ll also make comment on the current opportunityin silver compared to the opportunity in the mining stocks.
Let’s start with a few questions that we receivedrecently and let’s reply publicly for the benefit of all.
From the Readers’ Mailbag
Q: There have been statementscirculating, mostly from those promoting physical precious metals, such asKITCO, etc., a lot more in the last days and weeks than usually, that thephysical silver prices are at a great premium to the paper(futures) prices, such as $1.50- 2.00 above spot prices. They areclaiming there is a serious present shortage.However, my investment advisor tells me that there is, in fact, currently asignificant glut of physical silver.
A: That’s more or less… Normal. The prices on thefutures market change fast, and the physical side takes some time to adjust.Sellers view the moves in futures as very brief, and hoping that prices willmove back up, they don’t want to sell their inventory at what they view asprices that are ridiculous and temporary. But as the time passes, the prices onthe physical market adjust. The same thing happened in 2013 when silver wasdeclining substantially. The physical market lagged, and people were claimingthat the physical market remains strong and that it’s all temporary,manipulative etc. Silver didn’t shoot back up then because of these claims, andit’s unlikely to soar back up for this reason right now.
The emphasis goes on “for this reason”, as weexpect silver to move higher in the very short term, and verify the breakdownby moving back up to the 2015 lows, before sliding further. The reasons areemotional (technical) – no market moves in the same direction indefinitely.
Q: Pleasecomment on the quote below:
But it's the supply side that haschanged the market. No matter what the idiot permabull silverbugs may claim,there is an glut of silver and the physical oversupply is from the big basemetals miners, e.g those with massive skarn or porphyry copper deposits in theAndes who suddenly started paying attention to their rather minor by-productcredit a few years ago when the streamer companies offered serious money forsomething they'd taken for granted until then. “
A: First of all, we want to say that we think thatsilver will soar exceptionally in the following years. Not before sliding evenmore before, though. I – PR – like to think of myself as silver’s fan, but nota fanatic. I was one of the very few people that refused to view the goldto silver ratio at about 80 as something bullish.
The supplyof silver is indeed relatively inelastic as it is mostly mined as aby-product. This is one of the reasons that makes silver so volatile. If itdeclines, the supply cannot be quickly limited to balance the price. If itsoars, the supply cannot be quickly increased to balance the price. It’s adouble-edged sword that currently makes the declines so significant, but alsoone that is likely to make silver soar particularly sharply in the final partof the next long-term upleg.
Q: I have been told thatextreme lows in the Silver:Gold ratio (as is currently) has in the past led tosignificant rallies.
A: In other words, extreme highs in the gold tosilver ratio (as is currently) has in the past led to significant rallies (ingold and silver).
And that’s true. The gold to silver ratio has beenin a long-term horizontal trend for decades moving between 100 and 15. When agiven resistance level in a trend (horizontal trend is still a trend) is being reached, it’s likely that theprice or ratio (whatever was in the trend) is going to reverse.
But it all changes dramatically once we see abreakout above the resistance level. That’s why breakouts (and theirconfirmations) are so important as a tradingtool.
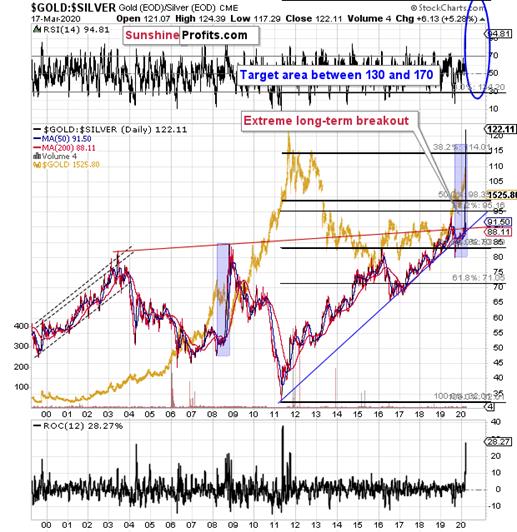
In case of the gold to silver ratio, we saw anextreme breakout. It normally takes at least several daily closes before agiven breakout is confirmed. This kind of confirmation arrived but was notnecessary because the breakout was so huge. It was definitely not accidental.
The breakout is a game-changer. It means that weare in uncharted waters and that it’s a tough call to say how high can the goldto silver ratio really rally, since it was just strong enough to pierce througha multi-decade resistance like a hot knife through butter.
The Fibonacci extension tool can be useful here.The point is to “extend” the previous major move in a given direction by a factorof 1.618, 2, or 2.618. The last two are most interesting as the extension basedon 1.618,was already reached and broken.
Based on these extensions, we get targets of 134and about 170 (barely visible on the above chart). If gold declines to $890after all, then the gold to silver ratio at about 170 would correspond to about$5 – close to its all-time lows.
Crazy? Wasn’t it just as crazy to expect silverbelow $12 just a month ago?
Let’s take a closer look at silver’s very long-termchart.
Silver in the Spotlight
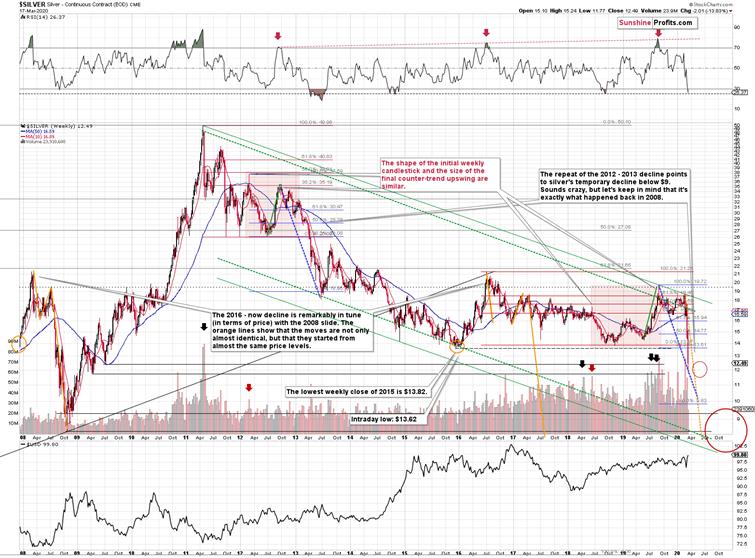
The analogy to 2008 that we outlinedon Monday (and that we’ve been featuring for many months) clearlyremains in place.
And so does the similarity to the 2012 – 2013slide. The former is marked with yellow, and the latter is marked with blue.
Based on both analogies, it’s about time (andprice) for silver to correct… Before declining even more.
The analogy to 2008 has been working remarkablywell in terms of prices. That’s what the yellow lines represent. The mostrecent slide in silver is almost perfectly in tune with the initial sharp slidethat we saw in 2008. Once you click on the chart to zoom in, you’ll see a thinblack line that shows the size of the slide in 2008, and you’ll see that wecopied it on the left side of the current decline. They are so similar thatit’s shocking even for us – and we’ve been writing about this extremesimilarity for many months.
How did silver perform then in 2008?
It corrected to the nearest strong horizontalresistance level and the relatively round number of $14. It was about midwaybetween the bottom and the 38.2% Fibonacciretracement. There was a second bottom after the initial one, twodays later.
How about the current situation?
Silver moved lower today, and while it didn’t movebetween yesterday’s and Monday’s intraday low, it’s already very close. It willtake silver only about 35 cents more to decline below yesterday’s low and tomake this rebound extremely similar to what happened in 2008. Then again,that’s just a cherry on the analytical cake, and the analogy to 2008 willremain intact even if the shape of today’s session is a bit different.
Silver is now a bit lower than it was in 2008 innominal terms, so the midpoint between the recent low and the 38.2% Fibonacciretracement is below the $14 level. Is there any significant horizontalresistance located over there? Of course, there is!
It’s the 2015 bottom – it formed at $13.62. Thistarget is aligned with the mid-point between the recent low and the 38.2%Fibonacci retracement.
And the analogy to 2012-2013? Please note at whatpace silver declined from the very first top (blue line). During the first veryvolatile slide, it corrected only after it reached the declining blue line.Guess what? Copying the same line to the recent final top (the 2019 one)provides us with a line that was just reached recently. This suggests thatsilver is about to rebound before moving again.
How high did silver rally during the analogouscorrection in 2013? It moved up by about 12.7%. Applying this kind of rally tothe recent low in silver provides us with $11.77 * 1.127 = $13.26 as the targetfor the next local bottom. Of course, this analogy is not as precise as the2008 one, so it can be used as its confirmation – this target is very close tothe 2015 low.
One more note regarding the 2013 corrective upswing.Please note that two days after the initial bottom, silver formed another locallow and then rallied in the following days. That’s exactly the same way silverbottomed (temporarily) in 2008.
Today is the day that’s two days after the initialbottom, so if silver moves temporarily lower today, please keep in mind thatit’s normal, and it doesn’t invalidate the scenario in which silver nowcorrects higher.
This could be what’s likely ahead for the stockmarket and other commodities as well. The S&P 500 futures are lower so fartoday, but this might be the final move lower before their corrective rally.Crude oil moved lower as well and it might be bottoming shortly (we just cashedin profits on our shortposition in crude oil about an hour ago). In tune with the above, miningstocks could decline early today, only to move back up later and/or in thefollowing days – we are not exiting our long positions in the miners at thistime.
In fact, the best risk to reward opportunitycontinues to be in the mining stocks in our view, even though silver is aboutto correct upwards.
It is often the case that silver outperforms miningstocks in the final part of a given rally, but after examining how correctiveupswings were shaped in different parts of the PM market during the 2008, 2011,and 2013 declines, it seems that this rule doesn’t really apply in case ofquick rebounds within bigger declines.
If we see signs that miners are underperforminggold and that silver would still have some sizable upside potential, we mightswitch our long positions from miners to silver. It’s too early to say if we’regoing to do it or not.
Also, we would like to take this opportunity toexplain why we are aiming to profit on miners’ rebound only. It’s not becausewe’re not forecastinggold or silver at (temporarily) higher prices. The corrective upswingis likely to take place, and it seems that it’s already in progress. The pointis that miners are usually the first to rally after a bottom, and they becameridiculously oversold in the short run recently, which made their run-up mostlikely and created the most favorable risk to reward setup. That’s why ourfocus is over here right now. There will be many times, when diversificationbetween gold, silver, and miners is the way to go, but right now, concentratingon the miners seems to be a better choice. This choice proved to be verylucrative over the last few days (especially that we entered the long positionsin the miners in the final 25 minutes of Friday’s session, almost right at theintraday low).
Thank you for reading today’s free analysis. Itsfull version includes detailed upside targets for our long positions in miningstocks that we entered in the last 25 minutes of Friday’s session (based onyesterday’s closing prices the UNLEVERAGED positions in GDX and GDXJ are about 50%profitable). We currently offer 10% discount for the first subscription period(even for the yearly subscriptions). Given how volatile the markets are, howprofitable our trades just were and currently are, and how much is likelyaround the corner, the time to subscribe was never better – subscribeat a discount today.
Thank you.
Przemyslaw Radomski, CFA
Founder, Editor-in-chief
Toolsfor Effective Gold & Silver Investments - SunshineProfits.com
Tools für EffektivesGold- und Silber-Investment - SunshineProfits.DE
* * * * *
About Sunshine Profits
SunshineProfits enables anyone to forecast market changes with a level of accuracy thatwas once only available to closed-door institutions. It provides free trialaccess to its best investment tools (including lists of best gold stocks and best silver stocks),proprietary gold & silver indicators, buy & sell signals, weekly newsletter, and more. Seeing is believing.
Disclaimer
All essays, research and information found aboverepresent analyses and opinions of Przemyslaw Radomski, CFA and SunshineProfits' associates only. As such, it may prove wrong and be a subject tochange without notice. Opinions and analyses were based on data available toauthors of respective essays at the time of writing. Although the informationprovided above is based on careful research and sources that are believed to beaccurate, Przemyslaw Radomski, CFA and his associates do not guarantee theaccuracy or thoroughness of the data or information reported. The opinionspublished above are neither an offer nor a recommendation to purchase or sell anysecurities. Mr. Radomski is not a Registered Securities Advisor. By readingPrzemyslaw Radomski's, CFA reports you fully agree that he will not be heldresponsible or liable for any decisions you make regarding any informationprovided in these reports. Investing, trading and speculation in any financialmarkets may involve high risk of loss. Przemyslaw Radomski, CFA, SunshineProfits' employees and affiliates as well as members of their families may havea short or long position in any securities, including those mentioned in any ofthe reports or essays, and may make additional purchases and/or sales of thosesecurities without notice.
Przemyslaw Radomski Archive |
© 2005-2019 http://www.MarketOracle.co.uk - The Market Oracle is a FREE Daily Financial Markets Analysis & Forecasting online publication.