Gold Upleg Fuel Abounds / Commodities / Gold and Silver 2018

 Gold and its miners’stocks have proven rare bastions of strength during recent weeks’ marketcarnage. They are powering considerablyhigher while nearly everything else burns. The markets’ major sentiment shift is accelerating a young gold upleg,which ought to grow much larger as speculators and investors continue returning. Their collective gold positioning remainsvery low, making for abundant gold upleg fuel.
October’soutperformance by gold and gold stocks has been impressive. As of Wednesday, the flagship US S&P 500broad-market stock index had plunged 8.8% month-to-date. That heavy selling was led by themarket-darling mega tech stocks, pummeling the NASDAQ down 11.7% MTD! Stock investors are starting to pay the piperfor getting far too complacent in bubble-valued markets, thereckoning is underway.
But contrariansprudently positioned in gold and its miners’ stocks have enjoyed largedivergent gains as flight capital floods in. Gold has surged 3.4% MTD despite the US Dollar Index’s strong 1.3%rally. The long-forsaken gold stockshave nicely amplified those gains, refusing to get sucked into the maelstrom ofheavy stock-market selling. The leadingHUI gold-stock index has blasted 8.2% higher MTD, 2.4x gold’s upside!
While mid-October’s stock-marketplunge out of the blue jumpstarted gold, its young upleg was already stealthilyunderway. Gold bottomed at $1174 inmid-August after getting pummeled by all-time record gold-futures short selling by speculators. It quickly rebounded ashigh as $1210 in late August, but drifted back down as low as $1183 in lateSeptember. This anemic gold upleg was already 7+ weeks old in mid-October.
Though gold didn’trespond much the first day the S&P 500 plunged 3.3%, the next day’s 2.1%follow-on selling galvanized goldinterest. It rocketed from $1194 to$1223 that day, a huge 2.5% rally that made for its biggest up day since late June2016’s surprise pro-Brexit vote in the UK! Those massive gold gains propelled the HUI a huge 7.4% higher thatday. Capital was deluging back into thismoribund contrarian sector.
While the gold andgold-stock gains in recent weeks were impressive, they remain quite small. From their respective mid-August andearly-September lows, gold and the HUI were only up 5.0% and 13.9% as of themiddle of this week. That’s hardly evenupleg territory, a mere start. Gold’slast major upleg unfolded in roughly the first half of 2016. While it was on the smaller side byhistorical standards, it offers perspective.
Gold surged 29.9%higher in just 6.7 months, catapulting the major gold stocks as measured by theHUI 182.2% higher in largely that same span! So what we’ve seen in recent weeks is nothing compared to the last majorgold upleg, let alone far-bigger previous ones. Today’s young gold upleg is only getting started. And with goldupleg fuel still abounding, odds are it and the resulting gold-stock uplegwill grow much larger.
Gold bull-market uplegsusually unfold in the same telescoping fashion. They are initially ignited by gold-futures speculators covering shorts. These traders are usually the only buyers atmajor lows following corrections when sentiment is hyper-bearish. They buy offsetting gold-futures longcontracts to close out their existing short contracts at profits. This short covering is the spark that firstkindles major gold uplegs.
That short coveringsoon burns itself out, as short-side traders have relatively-little capitalcompared to the other gold buyers. Butit often propels gold high enough for long enough to entice long-side gold-futures speculators toreturn. They command much more capitalthan the shorts, and their buying soon becomes self-feeding. The more gold-futures contracts they buy, themore their peers start chasing that momentum.
That long-buying secondstage eventually evokes gold uplegs’ third stage, the primary one and largest by far. All the gold-futures buying extends gold’srally enough to get investors interested in returning. They control vastly more capital than futuresspeculators, so once they start buying gold is off to the races in a major newupleg. Unlike short-lived gold-futuresbuying, gold investment buying can run for many months on end.
Stage-one gold-futuresshort covering is the initial trigger that ignites stage-two gold-futures longbuying. And all that futures buyingtogether eventually jumpstarts stage-three investment buying. As investors start to return to gold in amaterial way, gold’s upleg accelerates in a self-sustaining virtuous circle. The more capitalinvestors pour into gold, the more it rallies. The more gold climbs, the more investors want to buy.
Today’s young goldupleg is starting to follow that usual three-stage pattern offueling buying. And since vast amountsof gold-futures short covering, gold-futures long buying, and investment buyingstill remain based on current positions, this gold upleg is likely to power way higher before it eventuallygives up its ghost. Gold looksexceptionally bullish today with upleg fuel abounding, portending much biggergains to come.
What gold-futuresspeculators and gold investors are actually doing and likely to do in coming months is discernable from two keydatasets. The first is the weeklyCommitments of Traders reports published by the CFTC, which detail speculators’collective positions in gold futures on a weekly basis. The second is the physical gold bullion heldin trust by the leading and dominant American GLD SPDR Gold Shares gold ETF.
We’ll start on thegold-futures side, as that’s where gold uplegs’ stage-one and stage-two buyingcomes from. This chart shows large andsmall speculators’ total long and short gold-futures contracts held, in greedand red respectively. Gold issuperimposed over the top in blue. Despite gold’s sharp rally when the S&P 500 plunged, the greatmajority of likely gold-futures buying isstill yet to come which is really bullish.
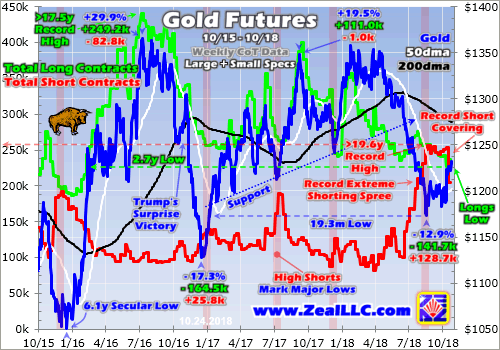
Gold’s woes thatultimately birthed today’s young upleg are recent. This classic contrarian investment actuallyfared pretty well from early 2017 to mid-2018, climbing higher on balance andholding above a rising support line for 17.4 months. Gold was trading at $1302 in mid-June beforeenormous gold-futures short selling erupted on a sharp USDX rally. That extreme short selling snowballed into a record shorting spree.
From mid-June to mid-August,speculators’ gold-futures shorts skyrocketed a stupendous 156% or 156.4kcontracts! That catapulted them to anextreme new all-time record high of 256.7k, as you can see above in red. That shattered the previous record of 202.3kfrom August 2015, which helped spawn that last major gold upleg in H1’16. Gold fell 9.9% in 2.1 months when that epicrecord short ramp was underway.
In early September Iwrote an extensive essay on those record gold-futures shorts explaining why they were so darned bullish. There’s nothing more bullish for gold than extreme speculator shortsbecause of how short selling works. These traders reverse the normal trading order by first selling highbefore later attempting to buy back low. But speculators don’t actually have the gold futures they want to sellshort.
So they must effectively borrow gold futures to shortthem. And these debts legally have to bepaid back soon. Mechanicallygold-futures shorts are repaid and closed by buying offsetting longcontracts. Thus speculators’ excessivegold-futures shorts are literally guaranteedproportional near-future buying! Andthe incredible leverage inherent in gold futures means this short coveringoften unfolds fast, over a couple months.
Back in earlySeptember, the minimum margin required for controlling each 100-troy-ouncegold-futures contract was $3100. Thisweek it’s $3400. At $1200 gold, 100ounces are worth $120,000. But a traderrunning at the margin limits can effectively buy or sell that much gold with crazy 35.3x leverage! In stock markets the legal maximum has been2x for decades now. At 35x, trading goldfutures is extraordinarily risky.
For every 1% the goldprice moves against traders’ positions, like rallying when they are short, theylose 35% of their own capital risked. Amere 2.9% gold rally would wipe out fully 100% of their capital at 35xleverage! And in mid-October on theS&P 500’s second big down day alone, gold surged 2.5%. That was driven by frantic speculatorsrushing to buy longs to cover their extreme near-record gold-futures shorts.
The weekly CoT reportsare current to Tuesday closes, but aren’t published until late Fridayafternoons. So the latest-available dataon speculators’ gold-futures positions when this essay was published wascurrent to October 16th, the CoT week straddling that sharp 5.3% 2-day plungein the S&P 500. Just as I warned inearly September, speculators’ near-record short-side bets resulted in record short-covering buying.
That CoT weekspeculators bought to cover an astounding 48.1k gold-futures shortcontracts! That was a new all-timerecord high, shattering the previous CoT-week record of 41.5k from March1999. Covering of this magnitude is exceedinglyrare. Out of the 1033 CoT weeks sinceearly 1999, only 11 witnessed short covering over 25k contracts. That frenzied short covering is why gold’sprice exploded higher that day.
Remember major golduplegs are initially ignited by stage-one gold-futures short-coveringbuying. And despite speculatorspanicking as stock markets plunged and covering nearly 1/5th of theirnear-record shorts in a single CoT week, their remaining shorts are still extreme. They were running way up at 205.0k in that latestCoT report, which would’ve been a record high before late July 2018. Much more covering is coming.
To just mean revertback down to mid-June levels before this summer’s record orgy of shorting,these elite traders still have to buy to cover another 104.7k contracts! That’s 2.2x what they did in that initial CoTweek, and the equivalent of a huge 325.6 metric tons of gold still due to be bought from shortcovering alone. Short-covering buyingout of extremes tends to unfold rapidly, over just a couple months or so.
So assume 7 more CoTweeks of speculators covering shorts on balance, which works out to 46.5t ofgold per week. According to the WorldGold Council’s definitive fundamental data, in the first half of 2018 total globalgold investment demand averaged 21.9t per week. So speculators’ buying to cover alone could boost this by 2.1x over the next couple months! That will naturally propel gold considerablyhigher.
Eventually gold willpower high enough for long enough to convince long-side gold-futuresspeculators to start buying again. Asthe higher green line above shows, they control a lot more capital than theshort-side guys. While they wield thatsame extreme leverage, their buying is totally voluntary. They don’t need to first borrow in order tobuy low then sell high. Their collectivebets just bounced off a deep 2.7-year low.
Merely to mean revertback to their 52-week high of 356.4k long contracts, these speculators wouldhave to buy another 119.4k from the latest CoT week’s low levels. That’s the equivalent of another 371.5t of gold. Stage-two gold-futures long buying by speculators generally unfolds over3 to 6 months. Assuming the conservativelatter gives us about 25 more weeks of buying on balance, averaging out to14.9t per week.
That alone would boostbaseline global gold investment demand from the first half of this year by 68%! And that’s not including that stage-one short-covering buying. You better believe gold will power a lothigher from here if world investment demand swells by 2/3rds for a half-year orso on gold-futures long buying. Massivegold upleg fuel remains on both the short and long sides of gold futures withcurrent positioning.
When gold surged 29.9%higher to enter a new bull in the first half of 2016, speculators’ total shortsfell by 82.8k contracts while their longs soared by 249.2k. That made for 332.0k of total buying. Including this first CoT week of buying on thatmid-October stock-market plunge, gold’s young upleg today easily has the potentialto see at least 152.7k contracts ofshort-covering buying and another 129.3k of long buying.
That adds up to 282.0kcontracts, equivalent to a colossal 877.1 metric tons of gold! World investment demand in H1’18 totaled just570.1t for comparison. With the buyingfuel for this upleg running around 85% of what drove early 2016’s 30%ish one,this gold upleg should have no problem rallyingover 25% from its mid-August lows. That would carry gold to $1467, a major bull breakout abovethe previous $1365 peak.
Nothing excitesinvestors more than new bull-market highs,which motivates them to chase the strong momentum. They allocate larger fractions of their vastpools of capital into gold, leading to sustained buying dwarfing anything thegold-futures speculators can manage. This stage-three investment buying is what makes gold uplegsawesome. All the futures buying leadinginto it is ultimately just a triggering mechanism.
This next chart looksat American stock investors’ capital flowing into and out of gold through thelens of that dominant GLD gold ETF. Unlike most gold fundamental data only available quarterly, GLD’sholdings are published daily. They offera near-real-time view into whetherinvestors are buying or selling gold. Iwrote a whole essay inlate September explaining the mechanics of GLD and its importance to goldprices.
GLD’s mission is totrack the gold price, but GLD shares’ supply and demand is independent fromgold’s own. Thus GLD’s managers have toequalize excess GLD-share buying or selling pressure directly into physicalgold itself or this ETF’s share price will decouple. So GLD effectively acts as a conduit for the vast pools of American stock-marketcapital to slosh into and out of gold. GLD’s changing holdings reflect this.
When investors arebuying GLD shares faster than gold is being bought, the GLD-share pricethreatens to breakaway to the upside. GLD’smanagers prevent this by issuing enough new GLD shares to satisfy the excessdemand. Then they plow the resultingproceeds directly into gold bullion which boosts this ETF’s holdings. Sorising GLD holdings mean investment capital is flowing into gold, whichnaturally bids it higher.
But the oppositehappened in recent months as investors dumped GLD shares faster than gold wasbeing sold. GLD’s share price would’vefailed to the downside if its managers hadn’t stepped in to sop up that excesssupply. They raised the capital to buyback GLD shares by selling some of its gold bullion held in trust forshareholders. Thus falling GLD holdingsreveal investment capital flowing out of gold, pushing it lower.
GLD’s physical-gold-bullionholdings held for its investors peaked at 871.2 metric tons in late April, andstarted to shrink as stock investors pulled capital from gold. Strong stock markets and that extremegold-futures-shorting-driven gold selloff contributed to the bearish sentimentand mass exodus. But that gold-negativetrend reversed sharply when the stock markets started plunging in mid-October,a major inflection.
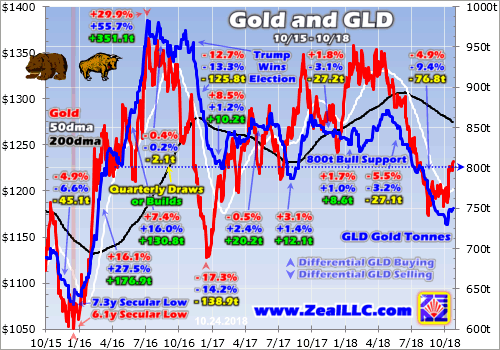
Gold tends to rallywhen stock markets weaken, making it the ultimate portfolio diversifier. Between late April and early October, GLD’sholdings relentlessly dropped 16.2% or 141.0t. GLD’s capital outflows in Q3’18 were the worst by far since Q4’16 whenTrump’s surprise election victory really goosed the stock markets and thushammered gold. By early October, GLD hadgone an incredible 2.6 months without any builds!
Remember the S&P500 clawed to more all-time record highs in late August and late September, sogold was deeply out of favor with investors. Why prudently diversify small fractions of stock-heavy portfolios withcounter-moving gold when stock markets seem to do nothing but rallyindefinitely? But that trend reversedhard that very day the S&P 500plunged 3.3% out of the blue in mid-October, GLD demand exploded.
As stock investorsshocked from their euphoric and complacent stupor rushed to buy GLD shares,there was so much differential buying pressure it forced a major 1.2% holdingsbuild! That was the largest in 6.7months, and the first build at all since late July. One serious day of stock-market selling wasall that was needed for investors to remember gold. That differential buying pressure persistedin subsequent days.
GLD’s holdings enjoyed further0.8% and 0.6% build days late that week and early the next, and have seenadditional builds this week. This earlystage-three investment buying spawned by renewed fears that stock markets can fall too has already boosted GLD’sholdings by 2.7% or 19.5t in just a couple weeks. And while stock selloffs help initiallyignite gold investment buying, it soon becomes self-feeding.
Investors love chasingwinners, so buying begets buying. The more anything rallies, the more investorswant to buy it. The more capital theydeploy into it, the more it rallies. That last major gold upleg back in the first half of 2016 was alsosparked by a stock-market correction, with the S&P 500 retreating 13.3% in3.3 months. As of this week this lateststock-market selloff was still a large pullback at 9.4% over 1.1 months.
That early-2016correction bottomed in mid-February, as gold was just nearing $1250. But once it had been ignited, that bigdifferential GLD buying pressure continued until early July ultimately pushinggold lots higher to $1365. Most of thatgold upleg happened after the stockmarkets had already bottomed and started marching higher again. The thing that killed that gold upleg was finallya new record high in the S&P 500.
Between mid-December2015 and early July 2016, GLD’s holdings soared 55.9% or 352.6t higher whichwas a major driver of that 30%ish gold upleg. To revisit those bull-to-date-high GLD-holdings levels today, this ETFwould have to add another 252.6t of gold to its holdings from its recentearly-October low. So there’s againplenty of room for massive stage-three goldinvestment buying to catapult this upleg far higher!
Investors were andremain radically underinvested in gold, it barely even registers in their portfolios any more. When GLD’s holdings sunk to 730.2t in earlyOctober, that was a deep 2.6-year low. American stock investors hadn’t been less deployed in gold sincemid-February 2016 when gold’s last upleg was still young before powering muchhigher. Like gold-futures speculators,investors too are positioned for big buying.
So gold upleg fuel abounds today! Gold-futures speculators still have massive stage-one short-coveringbuying left to do, and have barely even started their also-huge stage-twomean-reversion long buying. And the bigstage-three investment buying that will ultimately follow the gold-futuresbuying is already getting underway early. Such enormous buying likely coming will drive gold’s young upleg muchhigher.
And while it’s notstrictly necessary beyond ignition, I suspect stock-market weakness willpersist and fuel even more gold investment demand. As I warned at the end of September when theS&P 500 remained near record highs, Q4’18 is the first quarter ever thatwould see Fed quantitative tightening run at its terminal $50b-per-month pace. I wrotean important essay detailing why that is this stock bull’s death knell.
To merely unwind halfof the Fed’s $3.6t of QE-conjured money created in preceding years, QT wouldhave to run at full steam for 30 months! These QE-inflated stock markets trading atbubble valuations are going to struggle greatly with QT underway. So October’s stock-market weakness is likelythe start of a major bear market, not a temporary correction before new record highs. That will greatly boost gold demand!
The gold miners’ stocks will really leverage gold’s coming gains as its young upleg grows. When gold’s last upleg surged 29.9% higher in the first half of 2016,that HUI major-gold-stock index skyrocketed an enormous 182.2% higher inroughly that same span! While that wasextreme 6.1x upside leverage, 2x to 3x is common and expected. Gold stocks are already amplifying gold’ssurge since mid-October by 2x.
The key to riding anygold-stock bull to multiplying your fortune is staying informed, both about broader markets and individualstocks. That’s long been our specialtyat Zeal. My decades of experience bothintensely studying the markets and actively trading them as a contrarian ispriceless and impossible to replicate. Ishare my vast experience, knowledge, wisdom, and ongoing research through ourpopular newsletters.
Published weekly and monthly, they explain what’sgoing on in the markets, why, and how to trade them with specific stocks. They are a great way to stay abreast, easy toread and affordable. Walking the contrarianwalk is very profitable. As of Q3, we’verecommended and realized 1045 newsletter stock trades since 2001. Their average annualized realized gainsincluding all losers is +17.7%! That’s double the long-term stock-marketaverage. Subscribe today and getinvested before gold stocks soar way higher!
The bottom line is thisyoung gold upleg is accelerating, greatly boosted by this month’s unexpectedplunging stock markets. Despitespeculators’ record gold-futures short covering on that drop, the lion’s shareof that stage-one gold-upleg-driving buying is still yet to come. And stage-two gold-futures long buying isbarely starting. So abundant buying fuelremains to propel gold dramatically higher in coming months.
That futures buyingultimately ignites the far-larger stage-three investment buying, which soontakes on a life of its own. But theshock of that out-of-the-blue stock-market plunge started attracting investorsback to gold early. They remain radicallyunderinvested in gold, with huge buying to do to reestablish some normalcy inportfolio allocations. Weaker stockmarkets will accelerate this overdue shift of capital back into gold.
Adam Hamilton, CPA
So how can you profit from this information? We publish an acclaimed monthly newsletter, Zeal Intelligence , that details exactly what we are doing in terms of actual stock and options trading based on all the lessons we have learned in our market research. Please consider joining us each month for tactical trading details and more in our premium Zeal Intelligence service at … www.zealllc.com/subscribe.htm
Questions for Adam? I would be more than happy to address them through my private consulting business. Please visit www.zealllc.com/adam.htm for more information.
Thoughts, comments, or flames? Fire away at zelotes@zealllc.com . Due to my staggering and perpetually increasing e-mail load, I regret that I am not able to respond to comments personally. I will read all messages though and really appreciate your feedback!
Copyright 2000 - 2018 Zeal Research ( www.ZealLLC.com )
Zeal_LLC Archive |
© 2005-2018 http://www.MarketOracle.co.uk - The Market Oracle is a FREE Daily Financial Markets Analysis & Forecasting online publication.