Gold, USDX: The Board is Set, the Pieces are Moving / Commodities / Gold and Silver 2021

A culminating point has been reached.With the USD Index being backed up by solid fundamentals, can gold hold theline?
Have you ever noticed how often thelanguage of war is used in finance and economics articles? A given company ison the defensive or the offensive, a stock is pushing forward, something elseis rallying, positions are being taken… who will fire first? It’s the case ofcontinuous push and pull factors that makes military strategies and conceptsrelevant to the subject of money.
Now, when it comes to gold and the USDIndex, it’s not the great battle of our time (in reference to today’s title),as Gandalf explained to Pippin in The Lord of the Rings, but it’s a battle,nonetheless. For the yellow metal, it could even be the deep breath before theplunge. We’ll soon find out.
With an epic struggle for supremacy setto unfold in the coming weeks, battle lines have officially been drawn: withthe USD Index hovering near its 50-day moving average and gold recapturing its50-day MA, negatively correlated assets have officially collided. And, as therules of engagement specify that to the victor go the spoils, which one islikely to wave the white flag?
Well, with the USD Index built on afoundation of relative fundamentals and gold a beneficiary of shiftingsentiment, the former remains locked and loaded and poised to neutralize thethreat. Case in point: despite the USD Index’s recent recoil, non-commercial(speculative) futures traders actually increasedtheir net-long positions last week .
Please see below:
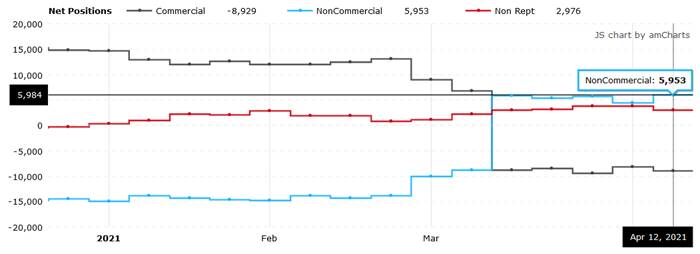
Source:COT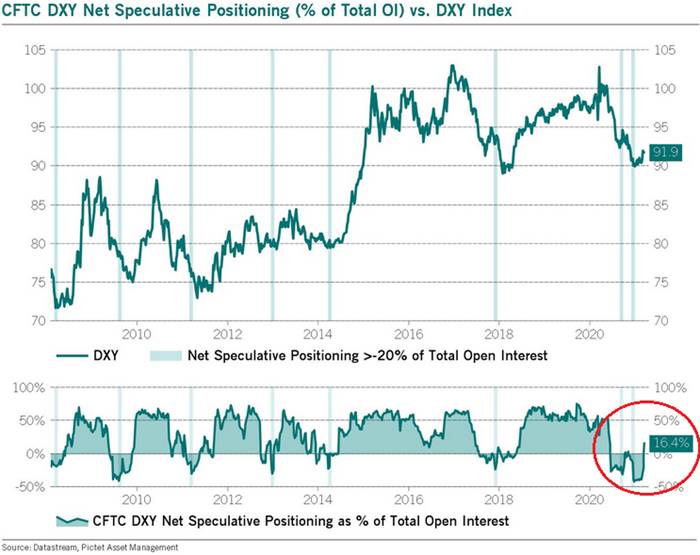
Moreover, let’s keep in mind that whennet-speculative short interest as a percentage of total open interest (based onthe CoT data) became extremely high in 2014 and 2018, the USD Index recoded two of itssharpest rallies in history. How sharp? Well, let’s take a look at how thingsdeveloped in the past – after all, history tends to rhyme.
Let’s focus on what happened when thenet speculative positions were significantly (!) negative and then they became significantly (!) positive, without payingattention to tiny moves (like the one that we saw last summer).
In short, rallies that began with extremepessimism include:
The current rally started at about 89,so if the “normal” (the above shows what is the normal course of action)happens, the USD Index is likely to rally to at least 94, but since the 5-indexpoint rally seems to be the data outlier, it might be better to base the targeton the remaining 5 cases. Consequently, one could expect the USD Index to rallyby at least 11 – 20 index points, based on the net speculative positions alone.This means the upside target area of about 105 – 114. Consequently, a comeback to the 2020 highs is not only very likely, butalso the conservative scenario.
In addition, let’s keep in mind that thevery bullish analogy to the 2018 rally remains intact. If you analyze the chart below, you can seethat back in 2018, the USD Index rallied sharply and then corrected back to itsprevious highs. And in similar fashion, the current weakness is nearlyidentical. More importantly, though, with the 61.8% Fibonacci retracement levelsitting just below the USD Index’s 50-day MA, the cavalry is already on theway.
Please see below: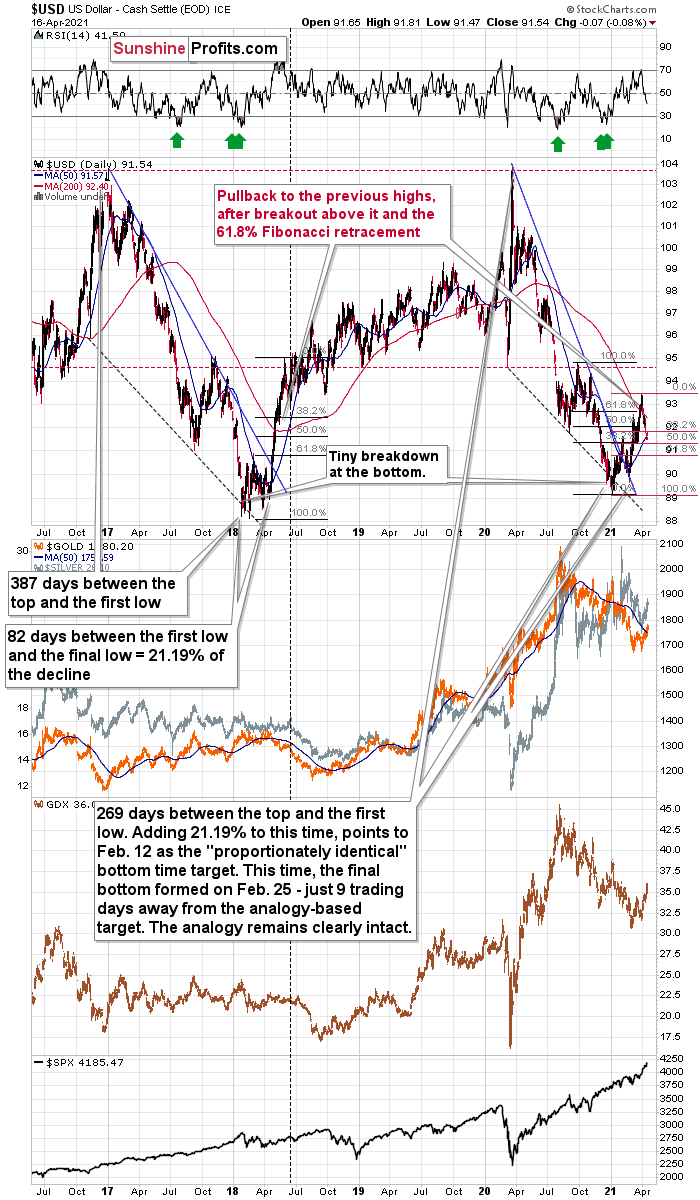
The current correction is much biggerthan what we saw in mid-April 2018, so it seems that what we see right now ismore of an analogy to what we saw in June 2018. That was the first bigcorrection after the breakout – above the 50-day moving average and thedeclining blue resistance line – that definitively ended the yearly decline.
I marked the situation from 2018 thatseems similar to what we see right now with a dashed, horizontal line. Back in2018, the pullback ended when the USD Index moved to its first Fibonacciclassic retracement level (the 38.2% one). In case of the current rally, Imarked those retracements with red. The USD Index is already below the firsttwo (taking today’s pre-market decline into account) and it seems to be on itsway to reach the final – most classic – 61.8% retracement. This kind ofretracement provides substantial short-term support and it’s something that’slikely to trigger a rebounding.
This retracement is slightly above the90.7 level, and at the moment of writing these words, the USD Index is trading at 91.14. This means that the USD Index can reach its very strong short-termsupport any day – or hour – now.
The very important detail about the June2018 decline (and bottom) is that while this was the moment after which the USDIndex’s started to move higher at a slower pace, it was also the moment afterwhich the precious metals market started to decline faster.
At the beginning of the year, I wrotethat the precious metals market was likely to decline and that the precedingrally was likely fake. That’s exactly what happened.
Right now, I’m writing that the recentrally was also fake (a correction within a medium-term decline) and – even moreimportantly – it seems likely that the next downswing could take place at ahigher pace than what we saw so far this year. And – just as was the case in2018 – this upcoming (fast) decline is likely to lead to the final bottom in the precious metals sector.
Of course, just because the bottom islikely to be formed in the following months, doesn’t mean that it’s in at thistime or that it’s a good idea to ignore the bearish implications of thesituation in the USD Index (as well as other indications pointing to lower goldprices).
As further evidence, the USD Index’s 2020decline has not invalidated itslong-term breakout. And with the long-term implications taking precedenceover the medium- and short-term ones, the USDX still has its guns pointed inthe right direction.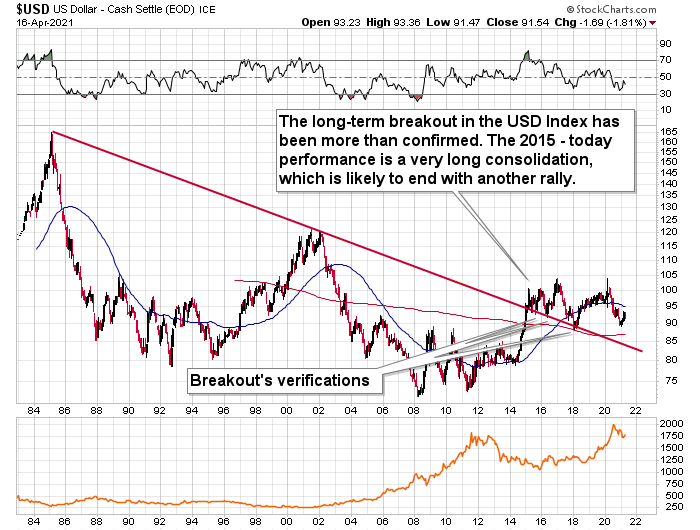
Adding reinforcements to its infantry,the USD Index also has another ally in the U.S. 10-Year Treasury yield. Aftersitting out much of the rally in 2020, the former has been following in thelatter’s footsteps since the New Year’s Day. And while the U.S. 10-YearTreasury yield’s frailty has been a negative over the last two weeks, thedynamic could be about to flip.
Please see below: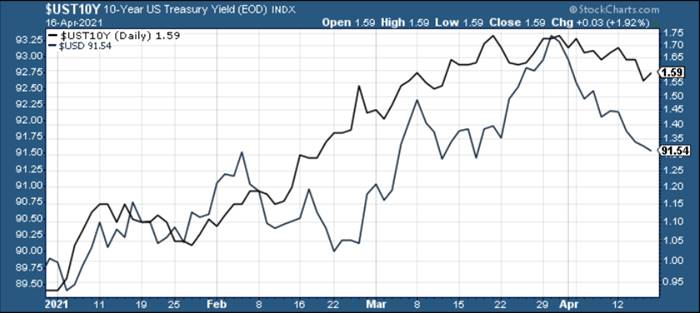
Trending in the opposite direction of theUSD Index futures, non-commercial (speculative) futures traders have moved fromnet-long to net-short the U.S. 10-YearTreasury Note . For context, bond prices move inversely of yields, so alower U.S. 10-Year Treasury results in a higher U.S. 10-Year Treasury yield.And after non-commercial (speculative) futures traders reduced their longpositions by nearly 43,000 contracts and increased their short positions bymore than 44,000 contracts, speculators went from being net-long nearly 84,600contracts to net-short nearly 2,700 contracts.
Please see below: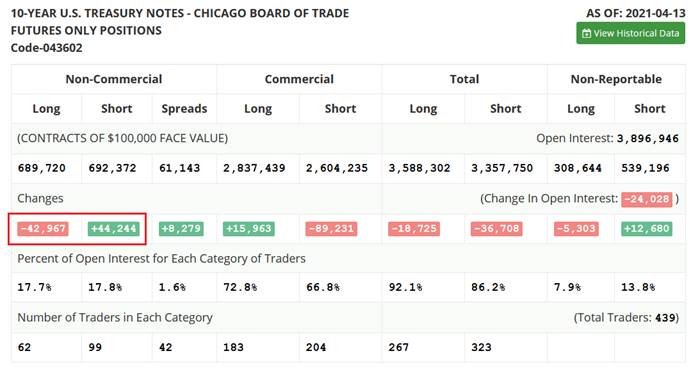
As a result, if the U.S. 10-Year Treasuryyield and the USD Index engage in an all-out offensive, their military mightcould indicate the death knell for the precious metals. Case in point: if youanalyze the table below, you can see that gold, silver and the mining stocks often move inversely to the U.S. dollar.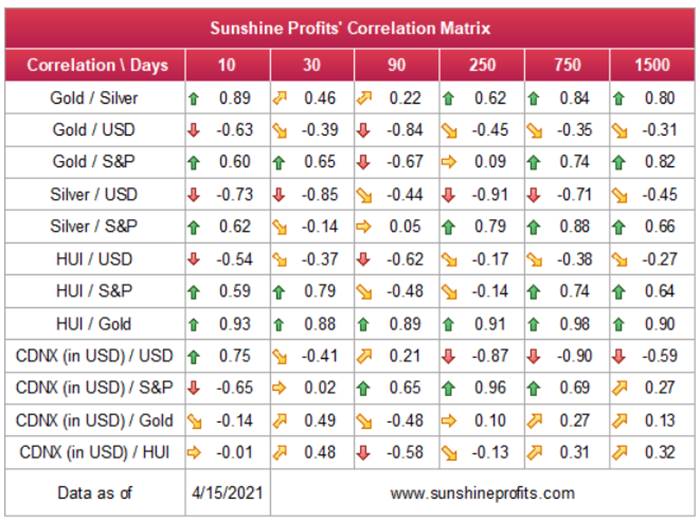
The bottom line?
Given the magnitude of the 2017-2018upswing , ~94.5 is likely the USDIndex’s first stop. And in the months to follow, the USDX will likely exceed100 at some point over the medium or long term
Keep in mind though: we’re not bullish onthe greenback because of the U.S.’s absolute outperformance. It’s because theregion is doing (and likely to do) better than the Eurozone and Japan, and it’sthis relative outperformance thatmatters , not the strength of just one single country or monetary area.After all, the USD Index is a weighted average of currency exchange rates, andthe latter move on a relative basis.
In conclusion, the generals have mapped outtheir strategies, soldiers have manned the perimeter, and the loser of theupcoming battle will likely end up losing the war. However, with the preciousmetals being outmanned and outgunned, the USD Index will likely plant itsvictory flag, while gold, silver and the mining stocks are forced to retreatand regroup. As a result, a major fallback is likely before the precious metalscan resume their long-term uptrend. Due to the USD’s breakdown below the 50%retracement, they could decline in the very near term (while gold rallies a bitmore – say to $1,800 or so), but don’t let that trick you into thinking thatthe next big move is going to the upside. In my view, that’s actually likely tobe an important top that’s then going to be followed by an even more importantdecline in the precious metals and mining stocks. Then, after several weeks ormonths of declines, PMs can bottom and finally soar without huge declines onthe horizon.
Thank you for reading our free analysistoday. Please note that the above is just a small fraction of today’sall-encompassing Gold & Silver Trading Alert. The latter includes multiplepremium details such as the target for gold that could be reached in the nextfew weeks. If you’d like to read those premium details, we have good news foryou. As soon as you sign up for our free gold newsletter, you’ll get a free7-day no-obligation trial access to our premium Gold & Silver TradingAlerts. It’s really free – sign up today.
Przemyslaw Radomski, CFA
Founder, Editor-in-chief
Toolsfor Effective Gold & Silver Investments - SunshineProfits.com
Tools für EffektivesGold- und Silber-Investment - SunshineProfits.DE
* * * * *
About Sunshine Profits
SunshineProfits enables anyone to forecast market changes with a level of accuracy thatwas once only available to closed-door institutions. It provides free trialaccess to its best investment tools (including lists of best gold stocks and best silver stocks),proprietary gold & silver indicators, buy & sell signals, weekly newsletter, and more. Seeing is believing.
Disclaimer
All essays, research and information found aboverepresent analyses and opinions of Przemyslaw Radomski, CFA and SunshineProfits' associates only. As such, it may prove wrong and be a subject tochange without notice. Opinions and analyses were based on data available toauthors of respective essays at the time of writing. Although the informationprovided above is based on careful research and sources that are believed to beaccurate, Przemyslaw Radomski, CFA and his associates do not guarantee theaccuracy or thoroughness of the data or information reported. The opinionspublished above are neither an offer nor a recommendation to purchase or sell anysecurities. Mr. Radomski is not a Registered Securities Advisor. By readingPrzemyslaw Radomski's, CFA reports you fully agree that he will not be heldresponsible or liable for any decisions you make regarding any informationprovided in these reports. Investing, trading and speculation in any financialmarkets may involve high risk of loss. Przemyslaw Radomski, CFA, SunshineProfits' employees and affiliates as well as members of their families may havea short or long position in any securities, including those mentioned in any ofthe reports or essays, and may make additional purchases and/or sales of thosesecurities without notice.
Przemyslaw Radomski Archive |
© 2005-2019 http://www.MarketOracle.co.uk - The Market Oracle is a FREE Daily Financial Markets Analysis & Forecasting online publication.