Gold Wants To Move Higher, But 2015-17 Stands In Its Way; BAR: A Cheaper Gold ETF Product
A decline that negated the bullish trading pattern.
A period of consolidation and a break to the upside.
Rising rates pushed gold to lows during the final months of the past three years.
Will gold negate the bearish pattern after it ignored the bullish one in 2018?
BAR is the cheapest game in town compared to other gold ETF products.
The gold market is now preparing to enter a time of the year where the price has made significant lows in 2015, 2016, and 2017. A seasonal pattern of lows during the final month of the year had corresponded to the actions of the U.S. Federal Reserve as they increased the short-term Fed Funds rates in each December since 2015 when liftoff from a zero-interest rate environment in the United States occurred.
The U.S. dollar is the world's reserve currency, so the price of gold can be highly sensitive to moves in both the dollar and U.S. interest rates. Rising short-term U.S. rates while those in Europe and Japan remain in negative territory has put upward pressure on the dollar. The long-standing inverse price relationship between the U.S. currency and the yellow metal has been a bearish factor of the price of gold.
At the same time, rising interest rates cause the cost of carrying commodities inventories or long positions to rise. In the gold market, higher real rates are a bearish factor while increasing rates that reflect mounting inflationary pressures on the U.S. and global economy can be supportive for the price of gold.
The price of gold fell to its lowest level of 2018 in mid-August at just above the $1160 per ounce level when the U.S. dollar index hit its high at 96.865. As the dollar has moved back to the 95-pivot point on the index, the price of gold recovered and was trading around the $1234 on October 24.
There are many choices when it comes to investing or trading in the gold market these days. One of the most popular instruments has been the SPDR Gold Shares ETF product (GLD). The iShares Gold Trust has also attracted lots of interest from investors and traders as it offers market participants a product that reflects a per share position that is one-tenth the size of GLD. Another product, the Granite Shares Gold Trust (BAR) is the brainchild of Will Rhind who has a long history of bringing ETF products to market. Will set out to build a better mousetrap for market participants, and while the net assets of BAR are still far below those of GLD and IAU, BAR offers significantly lower fees when it comes to its expense ratio while also providing liquidity for those seeking to position in the gold market via unleveraged ETF products.
Meanwhile, the price action in the gold market since April 2018 has left lots of market participants wondering if the yellow metal will recover given rising rates and a strong dollar.
A decline that negated the bullish trading pattern
The writing was on the wall after the rally in gold failed in April from the same level it peaked at in late January at $1365.40 per ounce on the continuous COMEX futures contract.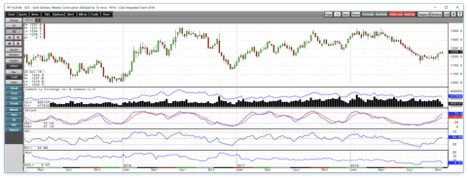
Source: CQG
As the weekly chart highlights, the price of gold corrected from the April high created a double top, and it kept on going on the downside. In July, it broke through critical technical support at the December 2017 low at $1236.50 per ounce. The break below the low from the final month of last year was a significant move as it was the first time since 2015 that gold traded at a price that was lower than the past December. The pattern of higher lows came to an end in the gold market in July, and by August 15 the price had dropped to the lowest level since early 2017 at $1161.40 per ounce. Gold hit its low as the dollar index futures contract hit its high at 96.865. Gold recovered from its low and entered a period of low volatility as the price consolidated around the $1200 level from late August until the second week of October.
A period of consolidation and a break to the upside
On the now active month December contract, gold traded to a high at $1388.10 in April and then turned south. 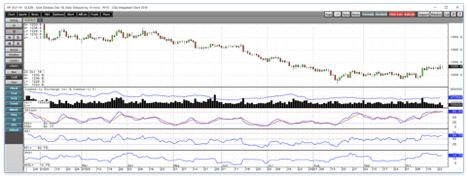
Source: CQG
The daily chart of December futures shows that the yellow metal traded in a range from $1185.30 to $1220.70 from August 20 through October 10. It looked like gold was on its way to a new low in September when silver probed below $14 per ounce and traded to its lowest price since early 2016, but the lack of selling in the gold futures market led to a recovery on October 11 as fear and uncertainty filled the market when stocks moved to the downside. Gold broke above the $1221 level and moved to a high of $1230 on October 11 and ultimately to $1243.00 on October 23. Since the break to the upside, the precious metal has established a higher trading range from $1219.30 to the October 23 high and was trading at $1234 per ounce on Wednesday, October 24. Price momentum on the weekly chart is rising towards overbought territory on the weekly chart, and on the daily chart, it has already reached an overbought condition. The dollar index was just off its mid-August high, on October 24 it was back above the 96 level after rallying from under 95 on October 16. Gold had been following the dollar, moving higher during sessions when the dollar is weak and lower when the greenback rallies. However, over recent sessions gold has displayed strength despite the move in the dollar index towards the mid-August high. Meanwhile, the dollar has been following U.S. interest rates which are rising.
Rising rates pushed gold to lows during the final months of the past three years
Over recent years, the high in gold came when the U.S. bond market made its high in July 2016. The historically low level of U.S. rates and the uncertainty created by the Brexit referendum in late June 2016 sent gold to its peak at $1377.50. 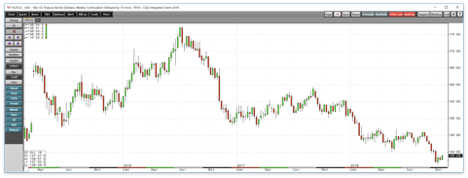
Source: CQG
As the weekly chart of the U.S. 30-year Treasury bond illustrates, the long bond rose to a high at 177-17 in early July 2016 around the time gold was bumping up against its highest level since March 2014, but the bond has been making lower highs and lower lows since then falling to its most recent bottom at 136-16 during the week of October 8. Lower bonds and higher interest rates have weighed on the price of gold for two reasons. First, rising interest rates in the U.S. on the short, medium and long end of the yield curve have supported the value of the dollar. The stronger dollar tends to weigh on the price of the yellow metal. The second reason is that higher interest rates increase the cost of carrying inventories in the commodities market and increase the cost of long positions in the gold market which has caused many longs to exit their positions.
When it comes to the gold market, interest rates are an enigma. Higher real rates are bearish for the yellow metal, but when rates rise because of inflationary pressures, gold tends to be a barometer for the economic condition that eats away at the value of money. Just because the dollar is strong as a result of interest rate differentials between the greenback and euro and yen these days, does not mean that all fiat currencies are not losing value in the current environment.
The Fed has told markets that inflation has increased to its two percent target rate and that they are not concerned about any spikes in the condition that caused buying power to decline. Many economists have downplayed inflationary pressures, but with the gold market trading between $1200 and $1235, the jury is still out when it comes to the yellow metal and its path of least resistance for the rest of 2018 and into 2019.
Will gold negate the bearish pattern after it ignored the bullish one in 2018?
Gold negated its pattern of higher lows in July when it fell below the December 2017 bottom at $1236.50 per ounce. As the final month of 2018 approaches, the precious metal will tell us if it will ignore another pattern that had developed since late 2015.
Gold found a bottom in December 2015 at $1046.20 per ounce. The low in gold coincided with the first interest rate hike by the FOMC and liftoff from a zero percent Fed Funds rate. The next low in the gold market came during the final month of 2016 at $1123.90 when the FOMC acted once again with its second rate hike which put the Fed Funds rate at 50 basis points. The Fed acted again in December 2017, but it was not the first rate hike of the year as the central bank increased the pace of increases in the short-term Fed Funds rate. During the final month of 2017, the price of gold hit its low at $1236.50, the price that gave way this past July. With December approaching and the Fed almost sure to hike rates by 25 basis points at their final meeting of the year, gold will need to decide if the mid-August low at just over the $1160 level will stand or if like over past years, a lower low is in store for the yellow metal.
Many other factors are facing the gold market as we move into the final two months of 2018. Stocks have begun to show cracks in their bull market under the weight of rising rates which has injected a dose of uncertainty and fear into markets across all asset classes. The current environment could drive some investors and traders into the gold market. Central banks remain net buyers of gold adding to total official sector reserves, but rising rates could launch the dollar to a new and higher high causing selling in gold because of the long-standing inverse correlation.
At the same time, sanctions on Iran will take effect on November 4, the trade dispute between the U.S. and China continues to escalate, and Saudi Arabia is under an international microscope after the murder of Washington Post journalist Jamal Khashoggi. President Trump has declared he is prepared to walk away from a nuclear treaty with the Russians. Many events will impact markets across all asset classes over the coming weeks and months, including the unknown, that could cause buying in the gold market. The yellow metal already negated a bullish pattern this year, and over the next two months we will find out if it ignores a bearish trend that has been in place since the end of 2015.
BAR is the cheapest game in town compared to other gold ETF products
I like the recent price action in the gold market, but I am proceeding with extreme caution because of the curse of December in the gold market. All systems appear to be a go for a Fed rate hike at their December meeting, but the increase will hardly come as a surprise to the market. After the most recent increase by the Fed in September, gold moved higher in the aftermath of the move.
For those who do not trade in the highly-leveraged and volatile futures arena, there are many choices when it comes to trading and investment vehicles in the gold market these days. The unleveraged gold ETF products include three tools that all do an excellent job tracking the price of the yellow metal. Gold moved from lows of $1184.30 on September 28 to a high of $1243.00 on October 23, an increase of 4.96%.
Over the same period, the SPDR Gold Shares ETF product (GLD) moved from $111.85 to $117.25 or 4.83% higher. GLD has net assets of $28.32 billion. GLD trades an average of 6.85 million shares each day, and the most widely-traded gold ETF charges an expense ratio of 40 basis points.
The iShares Gold Trust EFT (IAU) is one-tenth the size of GLD, and it moved from $11.33 to $11.88 over the same period, an increase of 4.85%. IAU trades an average of 12.4 million shares each day and has net assets of $10.21 billion. IAU charges an expense ratio that is lower than GLD at 25 basis points. Finally, the most thinly traded and newest of the gold ETFs is the GraniteShares Gold Trust ETF (BAR). Over the period, BAR moved from $117.95 to a high of $123.59, or 4.78% higher. However, BAR is the lowest priced product as it charges 17.49 basis points and had $291 million in net assets as of October 24. BAR trades an average of only 19,175 shares each day as the newest member of the gold ETF class continues to build liquidity. The prospectus for BAR outlines the product, and founder Will Rhind who was involved in the rollout of PPLT and GLD has attempted to create a better mousetrap in the gold ETF market and offer market participants the least expensive product when it comes to a position that replicated the price movement of the yellow metal.
I will be watching the performance of BAR compared to GLD and IAU over the coming weeks and months. If the correlation with gold and the other ETF products continues to match, the lowest cost ETF in the market with an expense ratio that is less than half of what the administrators at GLD charges could become my go-to product for trading gold in standard trading accounts.
Meanwhile, it looks like the price of gold is leaning higher these days, but the price action over the coming two months will tell us if it has the power to break the bearish end of year pattern that has been in place since December 2015.
The Hecht Commodity Report is one of the most comprehensive commodities reports available today from the #2 ranked author in both commodities and precious metals. My weekly report covers the market movements of 20 different commodities and provides bullish, bearish and neutral calls; directional trading recommendations, and actionable ideas for traders. More than 120 subscribers are deriving real value from the Hecht Commodity Report.
Disclosure: I/we have no positions in any stocks mentioned, and no plans to initiate any positions within the next 72 hours.
I wrote this article myself, and it expresses my own opinions. I am not receiving compensation for it (other than from Seeking Alpha). I have no business relationship with any company whose stock is mentioned in this article.
Additional disclosure: The author always has positions in commodities markets in futures, options, ETF/ETN products, and commodity equities. These long and short positions tend to change on an intraday basis.
Follow Andrew Hecht and get email alerts