Gold Warning - Here Are the Stunning Implications of Plunging Gold Price - Part 1 / Commodities / Gold & Silver 2019

 Goldis turning vigorously lower. And not only gold at that. Red, red, everywhere inprecious metals you look. The silent scream we wrote about yesterday broughtserious repercussions. In this article, we devote extraordinary attention tothe short-term picture throughout the PMs complex. Stay tuned as in the comingday(s) we’ll explain here how it affects the long-term charts and the 2012-2013– now link in gold. That will be so much more than a great and actionablesummary.
Yesterday’sAlert was quick and timely as it was important to keep our subscribers informedas gold and silver approached their resistance levels. Today, both metals aremoving lower in the pre-market trading- silver erased more than 48 hours ofgains and gold more than 24 hours of gains.
Let’sbeing with a look at the overnight performance. It’s important because it showsprices are already much lower than it might appear based on the daily charts.
Feelingthe Pulse of Gold, Silver and USD Index
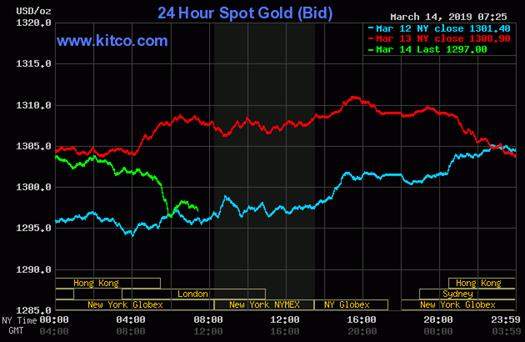
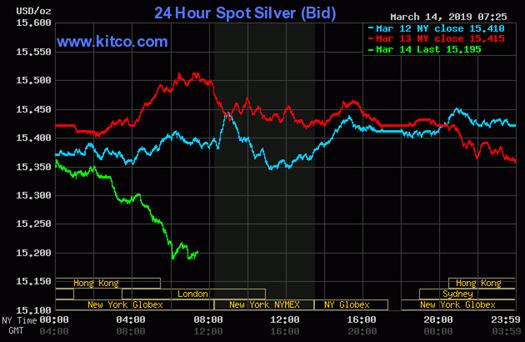
Afew hours can make a lot of difference, especially for the silver price. Silveris not only below yesterday’s lows – it’s also below Tuesday’s lows. About 15cents below them. The attempt to ignite a rally seems to have failed. In caseof gold, it’s not as crystal clear, but still clear enough. The yellow preciousmetal moved below yesterday’s lows, erasing the entire daily gain and a invalidating the brief breakout above $1,310. It’salmost as low as it was 48 hours before. This means that the $1,310 level thatwe described as strong resistance, has indeed held. This adds the necessarycontext to the following daily charts.
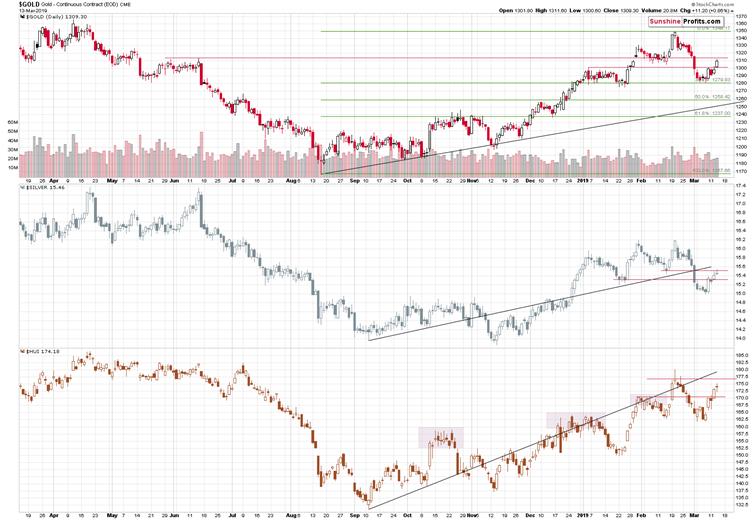
Onthe above chart, we see that silver reversed, that miners moved higher, butonly a bit, and that gold rallied. Based on the previous intraday charts, wealready know that both precious metals have already invalidated yesterday’sstrength and that there was no breakout above the resistance levels.
Wewarned that if the USD Index declines once more before rallying, PMs might movea bit higher, but that it would likely not be anything to call home about – andit seems that is exactly what has happened.
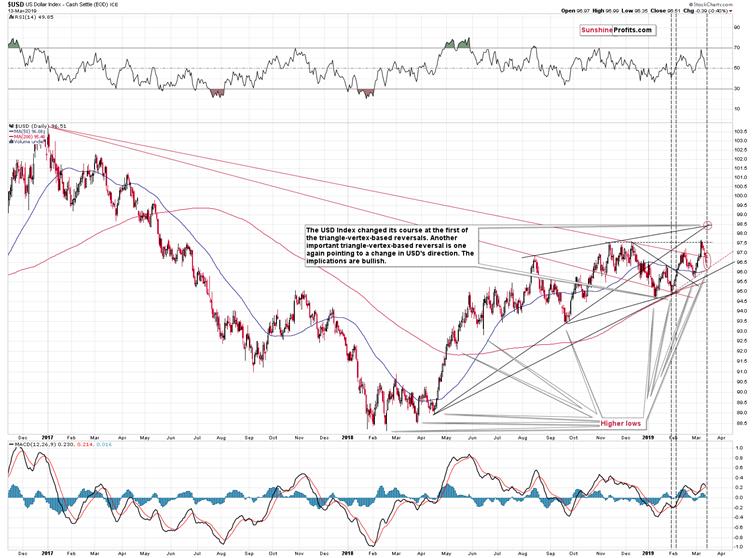
TheUSD Index moved to the lower one of our mid-March target areas.
What’s so special about themiddle of March? Why are the targets at that time?
It’sbecause of the triangle-vertex-based reversal that suggested animportant top or bottom in mid-March. Please note how well this techniqueworked previously – after the first month of the year, the USDX bottomed andmoved to new yearly lows. Based on the most recent short-term decline, it seemsthat the next turnaround is going to be a local bottom or that the bottom hasalready formed.
Beforemoving back to the PMs, please take a look the bottoms that we saw since early2018. For more than a year, we’ve been seeing higher lows. We also saw higherhighs on average, but it’s not as clear, as it is in case of the bottoms. Thisis the very definition of a bull market – higher highs and higher lows.
It’salso interesting that the pace of growth of the USD Index declined after May2018. You see, the USDX has actually… Corrected after the powerful April – May2018 upswing. It’s not clearly visible, because it’s a running correction. This is the kind ofcorrection where the market needs to take a breather, but it’s actually toostrong to decline during this correction, so it just moves sideways. It’scharacteristic of only the strongest bull markets for the sideways movement totake the price higher on average. One of the general tradingtips is to be on a lookout for these corrections as they can provide great tradingset-ups for the following moves. And that’s exactly what we saw in case of theUSD index.
Whenthe USD Index breaks above the corrective pattern, it’s likely to soarand take the PMs to much lower levels. And it seems that it’s about to takeplace.
Movingback to the PMs, we would like to point your attention to the way silvercorrected.
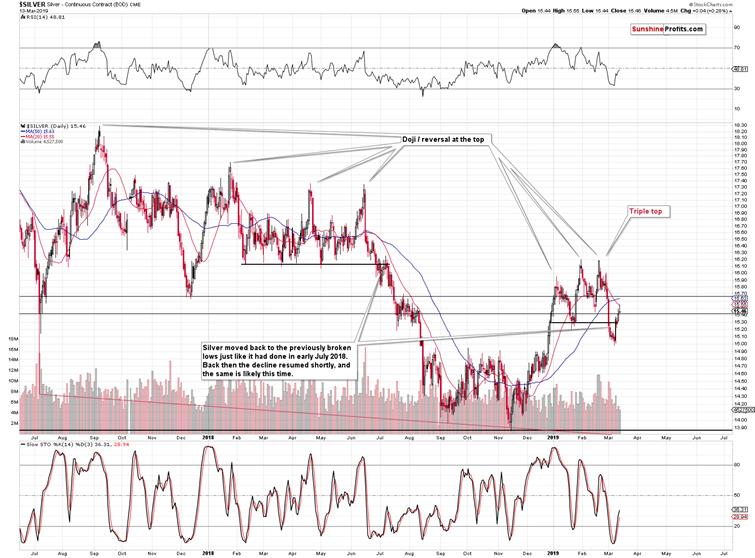
Themove in the white metal is very similar to what we saw in July 2018. Inparticular, it’s similar to both situations: from July’s beginning, and fromits final part. Silver moved back to the previous low and to the 20-day movingaverage (marked with red). Silver’sshooting star candlestick is also a bearish indicationbecause that’s the way in which silver ended the early-July 2018 correction.Yesterday’s reversal was not confirmed by strong volume, which would be aconcerning factor if it wasn’t for two facts:
Theearly-July 2018 reversal also formed on relatively low volumeIt’ssilver. Many general technical rules don’t apply to silver or they apply, butin a non-standard way (silver’s breakouts often turn into fakeouts etc.). This is what makes silver so difficult to trade for beginners.Theimplications for short-term precious metals charts are bearish.
We hope you enjoyed today’sanalysis, and we encourage you to sign up for our free newsletter. You’ll beupdated on our free articles on a daily basis, and you’ll get access to ourpremium Gold & Silver Trading Alerts for the first 7 days as a startingbonus. And yes, it’s free. Sign up today.
Thank you.
Przemyslaw Radomski, CFA
Founder, Editor-in-chief
Toolsfor Effective Gold & Silver Investments - SunshineProfits.com
Tools für EffektivesGold- und Silber-Investment - SunshineProfits.DE
* * * * *
About Sunshine Profits
SunshineProfits enables anyone to forecast market changes with a level of accuracy thatwas once only available to closed-door institutions. It provides free trialaccess to its best investment tools (including lists of best gold stocks and best silver stocks),proprietary gold & silver indicators, buy & sell signals, weekly newsletter, and more. Seeing is believing.
Disclaimer
All essays, research and information found aboverepresent analyses and opinions of Przemyslaw Radomski, CFA and SunshineProfits' associates only. As such, it may prove wrong and be a subject tochange without notice. Opinions and analyses were based on data available toauthors of respective essays at the time of writing. Although the informationprovided above is based on careful research and sources that are believed to beaccurate, Przemyslaw Radomski, CFA and his associates do not guarantee theaccuracy or thoroughness of the data or information reported. The opinionspublished above are neither an offer nor a recommendation to purchase or sell anysecurities. Mr. Radomski is not a Registered Securities Advisor. By readingPrzemyslaw Radomski's, CFA reports you fully agree that he will not be heldresponsible or liable for any decisions you make regarding any informationprovided in these reports. Investing, trading and speculation in any financialmarkets may involve high risk of loss. Przemyslaw Radomski, CFA, SunshineProfits' employees and affiliates as well as members of their families may havea short or long position in any securities, including those mentioned in any ofthe reports or essays, and may make additional purchases and/or sales of thosesecurities without notice.
Przemyslaw Radomski Archive |
© 2005-2019 http://www.MarketOracle.co.uk - The Market Oracle is a FREE Daily Financial Markets Analysis & Forecasting online publication.