Gold Warning - This is Not a Buying Opportunity / Commodities / Gold & Silver 2020

Goldrallied by $17.20 yesterday (1.08%), while silver soared by $0.42 (2.35%),which means that silver more than doubled gold’s rally. Silver is outperforminggold, which was both profitable, and informative. Gold miners moved higher evenmore (4.60% in case of the HUI Index), indicating that the final part of therally is not yet over but rather that we are still in it. Alternatively, itcould mean that yesterday’s session was the top, but given today’s pre-marketmoves higher in gold and silver, the former seems much more likely. In otherwords, gold and silver are likely to move higher shortly.
Onequestion is how far are they likely to move, but the key question is how likelyit is that they will indeed move higher.
Atfirst sight, the situation is as bullish as it gets:
theUSD Index might be topping here while being very overbought from the short-termpoint of viewgold,silver, and mining stocks showed exceptional strength by rallying despite USD’srallygoldand silver broke above their declining resistance linesminersshowed strength and created a bullish price gap yesterdayIndeed,these are all factors that will likely make one consider jumping in theprecious metals market with both feet without warm-up. Caution is warranted,though. There are also other factors and a what-if case that’s becomingincreasingly important that need to be considered. While at it, take a look atthe other goldtrading tips to consider.
Let’sstart with the last two points.
PMsin the Short-Term, Seasonality and Gold Tops
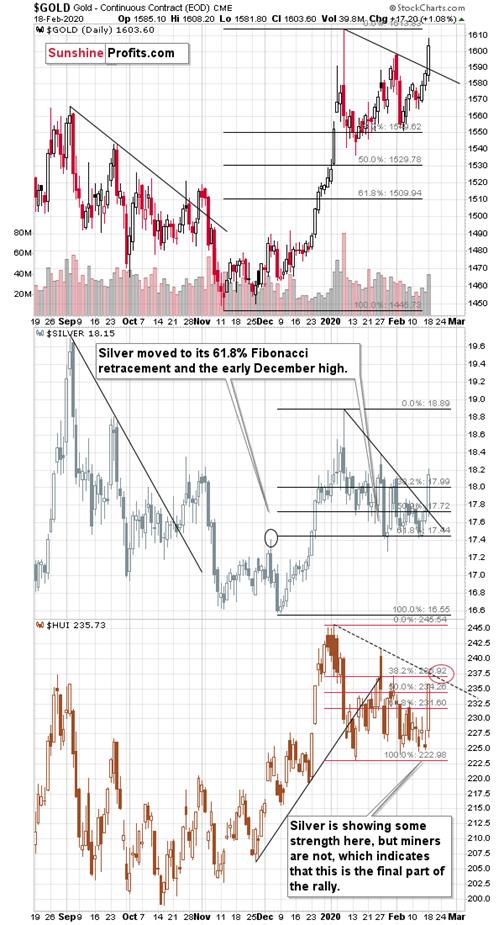
The breakouts above the declining resistance lines as well as the bullish price gap in themining stocks are bullish, but only for the short term. In fact, they may bebullish only for the very short term. Remember the late-October breakouts andthe subsequent rally? It ended the second day after the breakout.
Thebullish price gaps in the mining stocks are often the starting points of bigrallies, but they are also seen at the beginning of relatively insignificantupswings. For instance, the early October 2019 rally started with a bullishprice gap. About 2 weeks later, miners moved to new lows.
Let’sdiscuss two more things before moving to the USD-related points.
First,gold’s bullish seasonality is about to become bearish.

Wehave only several additional days in which gold is likely to show strengthbased on what it used to do in the previous years. Precisely said, since itbecame clear that the gold’sbull market started – since 2002.
Thissuggests that any rally here is not likely to persist for long.
Thesecond thing that we would like to feature, is the analogy to the previous pricepatterns that we saw right after gold topped on huge volume. Yes, weknow that we’ve been writing about it for weeks now, but record-breaking volumein gold is so important that this is definitely justified.
Therally to or close the previous yearly high would be in perfect tune with howgold behaved after previous tops that formed on huge volume.
Thethree very similar cases volume-wise and volatility-wise are the September 2008top, the 2011 top, and the early 2018 top. How did gold perform immediatelyafter the tops?
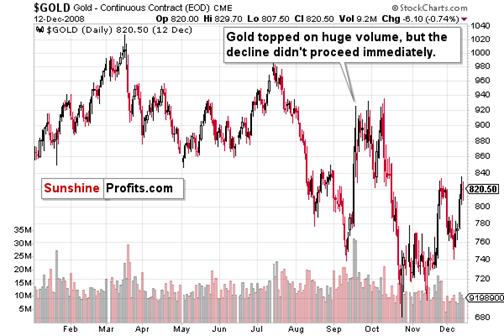
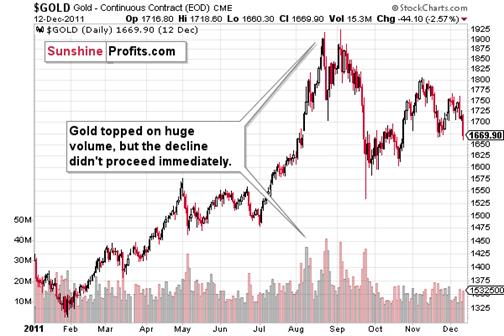
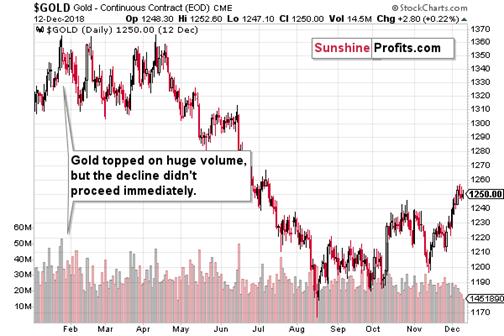
Inall three cases, gold topped on huge volume, but the decline didn't proceedimmediately. There was a delay in all cases and a re-test of the previous high.The delay took between several days and a few months.
Sincea similar pattern followed the huge-volume tops, it seems that we might see are-test of the recent high in the near future. Don’t get us wrong – the truerally has most likely ended, but we might see a move close to the January high,a move to it, or even a move that takes gold very insignificantly above it.That’s when people bought gold at the top in 2008, 2011, and 2018, and we don’twant you to fall for this market trick. Knowing what happened then – hugedeclines in the price of gold – should prevent you from buying on hope for a breakout to new highs. Oh, and by huge declines, we mean the ones wheregold declined by hundreds of dollars.
Thismeans that gold is not likely to soar very far. At the moment of writing thesewords, gold futures’ pre-market high is $1,612.45, which is just $0.85 belowthe January record-volume top.
Inall three above-mentioned cases, gold’s final top formed a few dollars aboveits initial top. Right now, gold is practically right at its previous top,meaning that – based on the above analogy – it’s likely to rally for a few moredollars and then form a top.
Goldcould get an extra boost from the , but even in this case, it’s unlikely to rally very far – atleast not in light of how it used to perform after previous huge-volumecoronavirusscaresessions.
Combiningall the above-mentioned factors, it seems that the reversal in gold could eventake place as early as today. A major news announcement could also trigger areversal – either directly, or indirectly as the tensions subside after thenews is already announced. There are several data points announced each day,but if there only was a way to check what’s particularly important for a givenmarket… Just kidding, of course there is such a way, that’s what Paul Rejczakis doing in his MarketNews Reports.
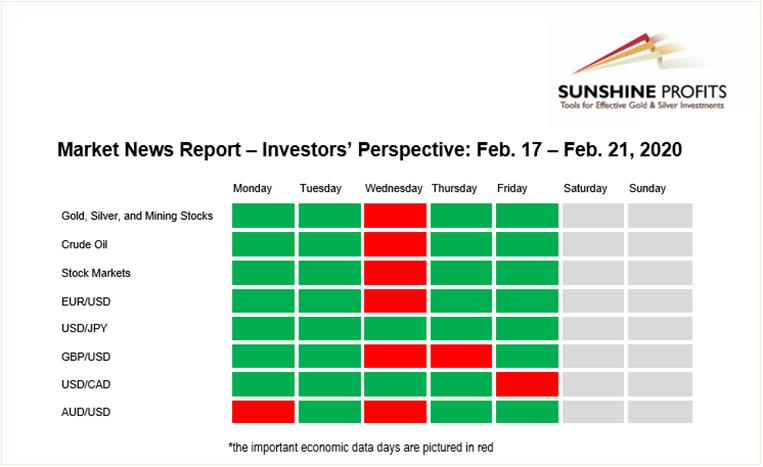
Basedon thisweek’s issue, we see that there is only one day of the week with majornews hitting the market (major meaning that they are important enough to beimportant also for the investors, not only for traders). The FOMCMeeting Minutes are being released today. While it may not seem thatimportant at first sight (after all, some may say that it’s just a report onwhat was already decided previously), it actually is important.
It’snot just a report – it’s a report that shapes expectations of investorsand traders alike. Since markets are forward looking, the expectations are ofcritical importance. If the Minutes manage to change people’s expectations,they will move the market.
Ok,ok, but what about US Dollar Index? Isn’t it topping right now? Shouldn’t itmake gold soar much higher?Thisis where the situation gets tricky.
First,yes, based on USD’s short-term factors, it’s likely topping.
Checkingon the USDX
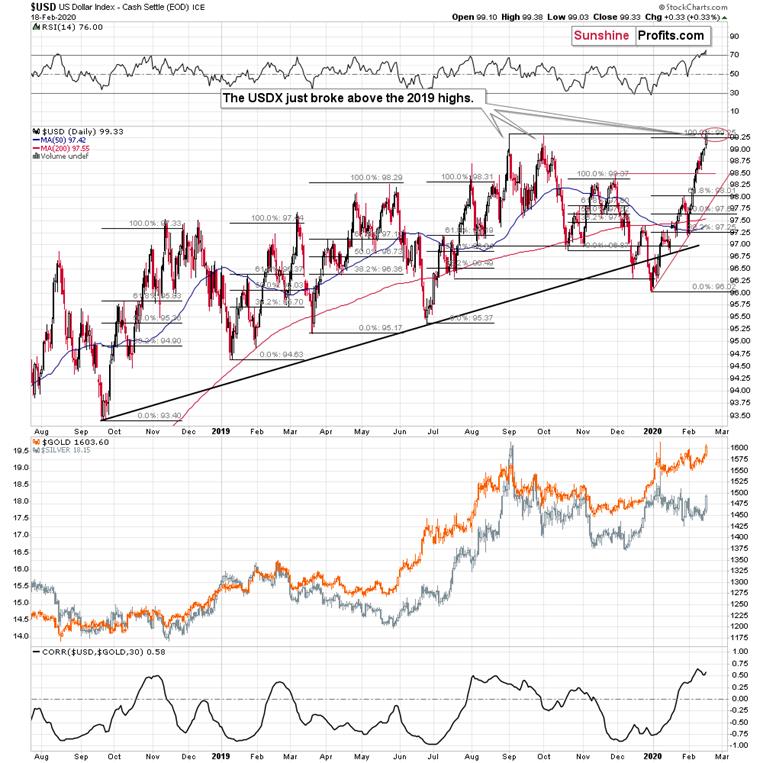
TheUSD Index hit our target area for this rally, it’s more overbought from theshort-term point of view than it’s been since mid-2018 (at least as measured bythe RSI).We saw a breakout above the 2019 highs, but the breakout was not confirmed. Ifit gets invalidated today, a sizable decline is likely to follow.
However,there’s more to the USD’s technical picture than just the short-term factors.
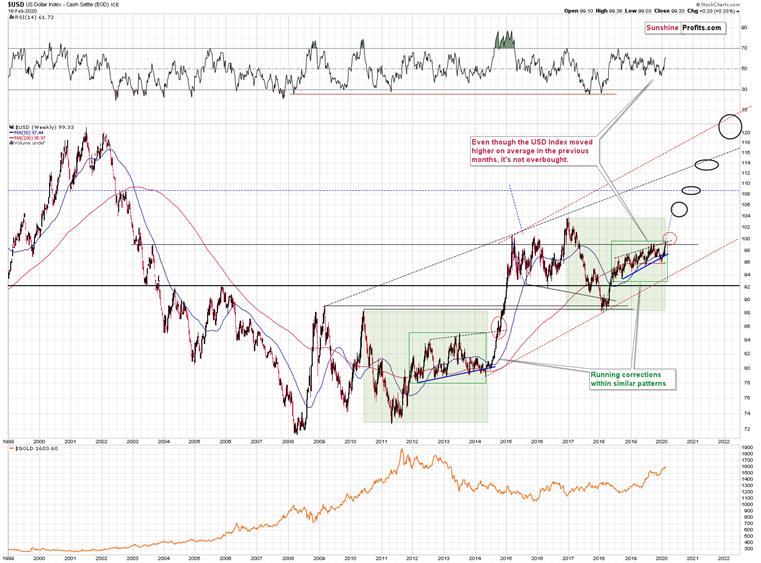
Onthe above long-term chart, you can see that the USD Index is not overboughtfrom the medium-term point of view. Its pace of growth may seem unsustainablefrom the short-term point of view, but the above chart shows that the USDXsoared at the same pace in mid-2018. And that rally didn’t stop just because itwas overbought from the short-term point of view.
TheUSD Index is moving up in a rising trend channel (all medium-term highs arehigher than the preceding ones) that formed after the index ended a very sharprally. This means that the price movement within the rising trend channel isactually a running correction, which is the most bullish type of correction outthere. If a market declines a lot after rallying, it means that the bears arestrong. If it declines a little, it means that bears are only moderatelystrong. If the price moves sideways instead of declining, it means that thebears are weak. And the USD Index didn’t even manage to move sideways. Thebears are so weak, and the bulls are so strong that the only thing that the USDIndex managed to do despite Fed’s very dovish turn and Trump’s calls for lowerUSD, is to still rally, but at a slower pace.
Thetemporary breakdown below the rising blue support line was invalidated. That’sa technical sign that a medium-term bottom is already in.
Interestingly,that’s not the only medium-term running correction that we saw. What’sparticularly interesting is that this pattern took place between 2012 and2014 and it was preceded by the same kind of decline and initial rebound as thecurrent running correction.
The2010 – 2011 slide was very big and sharp, and it included one big correctiveupswing – the same was the case with the 2017 – 2018 decline. They also bothtook about a year. The initial rebound (late 2011 and mid-2018) was sharp inboth cases and then the USD Index started to move back and forth with highershort-term highs and higher short-term lows. In other words, it entered arunning correction.
Theblue support lines are based on short-term lows and since these lows wereformed at higher levels, the lines are ascending. We recently saw a smallbreakdown below this line that was just invalidated. And the same thinghappened in early 2014. The small breakdown below the rising support line wasinvalidated.
Sincethere were so many similarities between these two cases, the odds are that thefollow-up action will also be similar. And back in 2014, we saw thebiggest short-term rally of the past 20+ years. Yes, it was bigger even thanthe 2008 rally. The USD Index soared by about 21 index points from the fakedownlow.
TheUSDX formed the recent fakedown low at about 96. If it repeated its 2014performance, it would rally to about 117 in less than a year. Before shruggingit off as impossible, please note that this is based on a real analogy – italready happened in the past.
Ifthe USD Index has been indeed repeating its 2010-2015 performance since 2017,then it would be likely to perform relatively similarly right now to how itperformed in 2014 when it had broken above its previous highs. We marked thosecases with red ellipses. Back in 2014, the USDX just pulled back sharply andthen continued its massive upswing.
Ifthat happens also shortly, the precious metals market will be likely to jump upquickly, but to plunge shortly thereafter.
Theabove is in perfect tune with what seems to be the most likely outcome alsobased on other factors that we discussed above.
Thismeans that what we’re looking at right now (gold’s test of its January high),is very far from being an obvious buying opportunity. Conversely, it looks likethe red light for gold’s decline is turning yellow and it will become greenvery soon.
Youhave been warned.
Summary
Summingup, it seems that the precious metals market is about to form a major top soon,and the easier part of this rally is already over. During the final upswing,gold might move to about $1,630, and silver might even reach its January high,at about $19.
Weare preparing to enter short positions in gold, silver, and mining stocks. Wewill let our subscribers know manually once we want to proceed.
Thankyou for reading the above free analysis. It’s part of today’s extensive Gold& Silver Trading Alert. We encourage you to sign up for our free goldnewsletter – as soon as you do, you'll get 7 days of free access to our premiumdaily Gold & Silver Trading Alerts and you can read the full version of theabove analysis right away. Signup for our free gold newsletter today!
Thank you.
Przemyslaw Radomski, CFA
Founder, Editor-in-chief
Toolsfor Effective Gold & Silver Investments - SunshineProfits.com
Tools für EffektivesGold- und Silber-Investment - SunshineProfits.DE
* * * * *
About Sunshine Profits
SunshineProfits enables anyone to forecast market changes with a level of accuracy thatwas once only available to closed-door institutions. It provides free trialaccess to its best investment tools (including lists of best gold stocks and best silver stocks),proprietary gold & silver indicators, buy & sell signals, weekly newsletter, and more. Seeing is believing.
Disclaimer
All essays, research and information found aboverepresent analyses and opinions of Przemyslaw Radomski, CFA and SunshineProfits' associates only. As such, it may prove wrong and be a subject tochange without notice. Opinions and analyses were based on data available toauthors of respective essays at the time of writing. Although the informationprovided above is based on careful research and sources that are believed to beaccurate, Przemyslaw Radomski, CFA and his associates do not guarantee theaccuracy or thoroughness of the data or information reported. The opinionspublished above are neither an offer nor a recommendation to purchase or sell anysecurities. Mr. Radomski is not a Registered Securities Advisor. By readingPrzemyslaw Radomski's, CFA reports you fully agree that he will not be heldresponsible or liable for any decisions you make regarding any informationprovided in these reports. Investing, trading and speculation in any financialmarkets may involve high risk of loss. Przemyslaw Radomski, CFA, SunshineProfits' employees and affiliates as well as members of their families may havea short or long position in any securities, including those mentioned in any ofthe reports or essays, and may make additional purchases and/or sales of thosesecurities without notice.
Przemyslaw Radomski Archive |
© 2005-2019 http://www.MarketOracle.co.uk - The Market Oracle is a FREE Daily Financial Markets Analysis & Forecasting online publication.