Gold Weekly: Facing A Volatile Macro Backdrop
Gold experiences wild swings amid a volatile macro backdrop.
Speculators turned very bullish on gold over March 20-27, the CFTC shows.
But ETF investors took some profit, FastMarkets' estimates show.
Elevated trade war fears set to dominate the market in near term. This is dollar-negative.
I have a long position in IAU, expecting a fresh 2018 high in Q2.

Source: Pinterest.
Introduction
Welcome to my Gold Weekly. I take this opportunity to wish you a very happy Easter and thank you for your support!
In this report, I wish to discuss my views about the gold market.
To do so, I analyse the recent changes in net speculative positions on the Comex (based on the CFTC) and ETF holdings (based on FastMarkets' estimates) and draw some interpretations about investor and speculator behavior. I conclude the report by sharing my trading positioning.
While the CFTC statistics are public and free, the data about gold ETF holdings are from FastMarkets, an independent metals agency which tracks ETF holdings across the precious metals complex.
Speculative positioning
Source: CFTC.
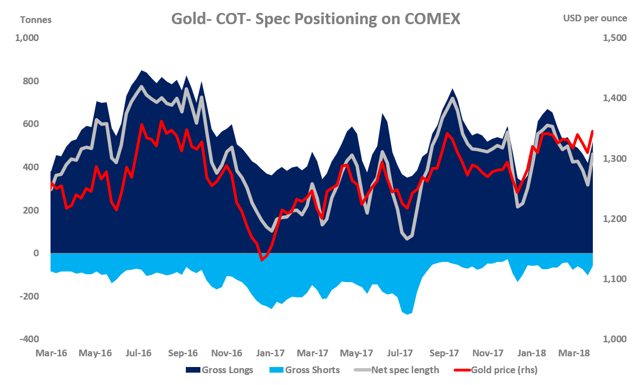
According to the latest Commitment of Traders report (COTR) provided by the CFTC, money managers lifted remarkably their net long positions for the first time in 3 weeks over the reporting period (Mar 20-27), during which spot gold prices rallied 2.3% from $1,310 per oz to $1,345.
The net long fund position - at 459.72 tonnes as of March 27 - jumped 142.76 tonnes or 45% from the previous week (w/w). This was the largest weekly increase since January.
The improvement in gold's spec positioning was mainly driven by long accumulation (+99.02 tonnes w/w) and reinforced further by short-covering (-43.74 tonnes w/w).
Gold's net long fund position is now up 154 tonnes or 51% in the year to date, after surging by 183 tonnes or 149% in the whole of 2017.
Gold's spec positioning is positive though not excessively long. The net spec length is at ~60% of its historical record and 40% higher than its historical average of ~325 tonnes.
Investment positioning
Source: FastMarkets.
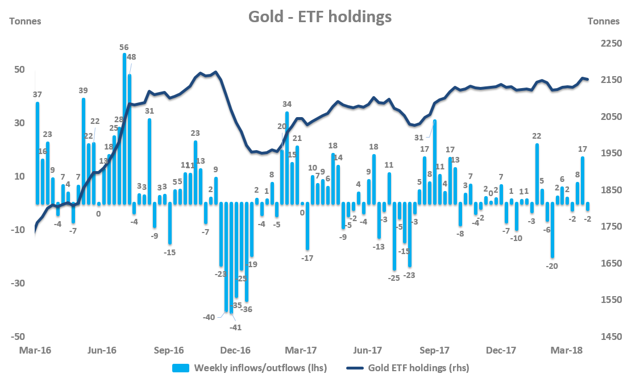
ETF investors were net sellers of 2 tonnes of gold last week - profit-taking was to be expected after the strong buying of 17 tonnes of gold in the preceding week amid a powerful rally in prices.
The pace of gold ETF activity was fairly subdued over the past week, with daily changes in gold ETF holdings ranging between -3 tonnes and +2 tonnes.
Most of the gold ETF outflows came from the SPDR GLD ETF (-4.42 tonnes) while the iShares Gold Trust ETF recorded a net inflow of 1.04 tonnes.
ETF investors were net buyers of ~19 tonnes of gold in March after liquidating 12 tonnes in February and buying 22 tonnes in January. In the year to date, ETF investors are net buyers of ~29 tonnes, corresponding to an increase of 1.4% in total gold ETF holdings.
As of March 30, 2018, gold ETF holdings totaled 2,152 tonnes.
Gold ETF investors were net buyers of 173.38 tonnes in 2017 (+9% from 2016) and 472.44 tonnes in 2016 (+32% from 2015).
Macro backdrop for gold
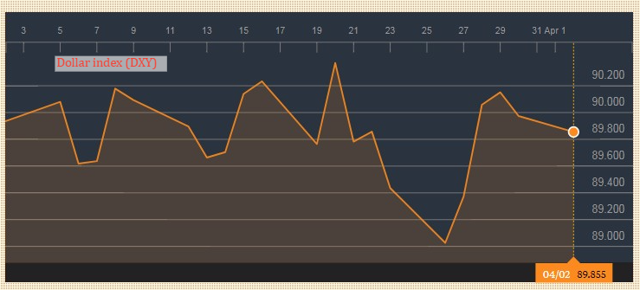
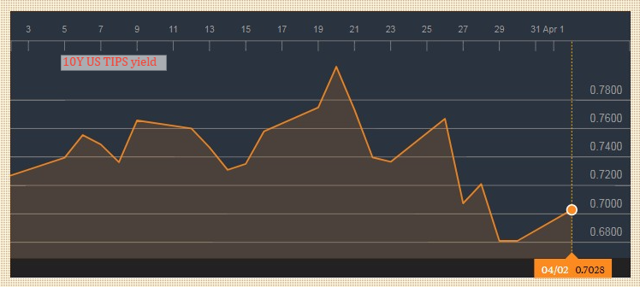
Changes in the macro backdrop for gold were fairly volatile into the end of March. The dollar (DXY as a proxy) and US real rates (10Y US TIPS yield as a proxy) experienced wild moves, as can be seen below.
Source: Bloomberg.
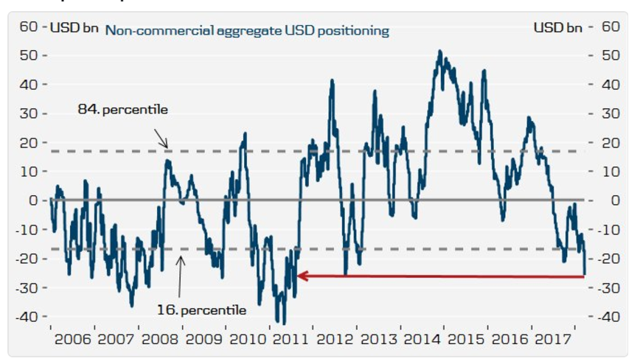
Since the second half of March, the moves in the dollar have been driven by the changes in market perception of a global trade war risk. For instance, the dollar rebounded strongly on March 27 after constructive talks between US Treasury Secretary Steven Mnuchin and Chinese officials, which eased investor fears over a full-scale global trade war. Yet, it seems to me that the dollar rebound was exaggerated by the too excessively negative positioning in the dollar. The CFTC data shows that the net spec length in aggregate dollar is at its lowest since 2012, which is incidentally very close to the 2011 bottom.
Danske Research.
In the near term, I expect fears over a global trade war to remain elevated, especially after China decided to respond to the tariffs imposed by the US in March, by implementing tariffs on 128 US goods including wine and frozen pork, which will be taking effect this week. This should exert downward pressure on the dollar, thereby benefiting gold prices. Gold's "haven trade" seems to be a comfortable trade to be in at this juncture.
Trading positioning
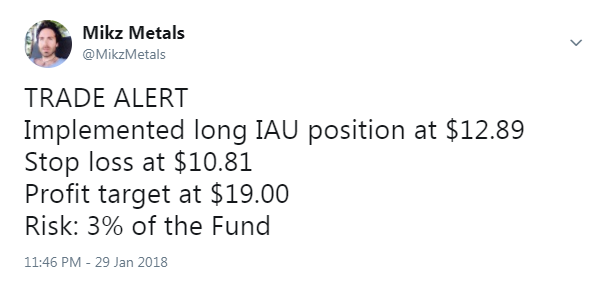
I have been long IAU since the start of the year. I implemented a long position in IAU on Monday 29 January, 2018, as can be seen in my Tweet below, which also shows the different parameters of my trade.
What is the technical picture for IAU telling us?
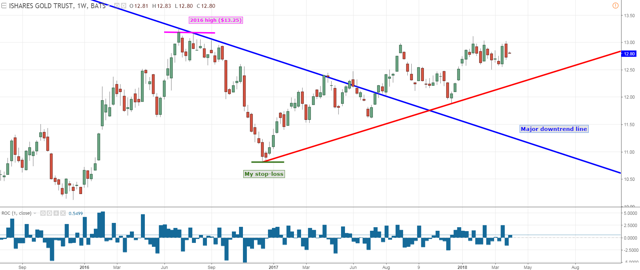
Source: Trading View.
As can be seen above, IAU sold off 1.54% last week, the largest weekly drop since November 2017. There confirms the presence of a clear resistance zone at ~$13. In this context, IAU is likely to retest this level several times in the coming weeks before firmly and sustainably breaking above it.
Momentum-based indicators are in positive territory, which could suggest a resumption of upward pressure in the immediate term.
A powerful rally in IAU is likely to start once the key resistance at the 2016 high of $13.25 is cleared. This is likely to happen during the course of the second quarter.
For the sake of transparency, I will update my trading activity on my Twitter account and post my trade summary at the end of each report.
Final note
My dear friends, thank so much for showing your support by clicking the "Follow" button and sharing this article. I look forward to reading your comments below.
![]()
Disclosure: I am/we are long IAU.
I wrote this article myself, and it expresses my own opinions. I am not receiving compensation for it (other than from Seeking Alpha). I have no business relationship with any company whose stock is mentioned in this article.
Follow Boris Mikanikrezai and get email alerts