Gold: What A Puzzle!
The latest gold breakout was supported by the data disclosed in the Commitments of Traders report.
However, the silver has not broken out yet.
One of the most popular gold mining ETFs, GDX, also cannot break above its short-term resistance level.
On the other hand, it looks like GDX shareholders are building a base for another leg up in precious metals.
As a result, I am cautiously optimistic about the precious metals market in the short term (but I do not expect a vicious bull market just now).
In my last article on gold, I made the following conclusion:
"On the other hand, the current consolidation looks like a base for a stronger move up in gold. However...this pattern is not filled yet. In other words, I still see no buyers interested in taking risk through opening a long position in gold futures"
Today, the general picture looks totally different, and positively for gold. Let me discuss this change.
The COT report
On December 4, 2018, the price of gold broke above its short-term resistance level at $1,240 per ounce (look at the lower panel of the chart and a green arrow pointing to this breakout):
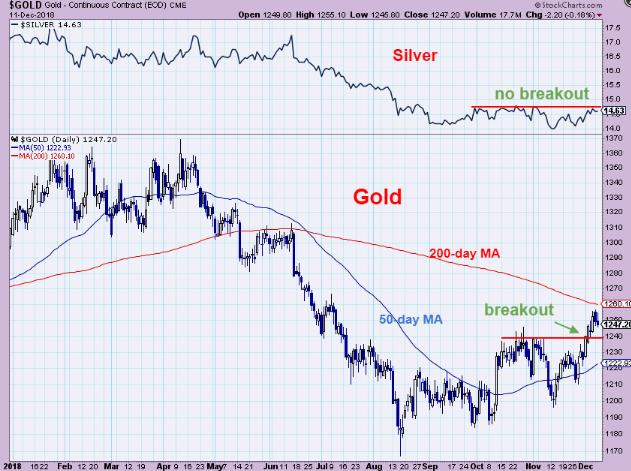
Source: Stockcharts
Then, a few days ago, the U.S. Commodity Futures Trading Commission released a breakthrough report for gold. By coincidence (and luckily), this report replicates the state of the market as of December 4 (the day the gold broke out). In other words, we have a unique chance to check whether the gold breakout was supported by the COT data. In my opinion, it was.
Now, before I go on, let me explain the terminology I am using. First of all, I am discussing the positions held by a group of traders called "money managers". According to the U.S. Commodity Futures Trading Commission:
"A "money manager," for the purpose of this report, is a registered commodity trading advisor (CTA); a registered commodity pool operator (CPO); or an unregistered fund identified by CFTC. These traders are engaged in managing and conducting organized futures trading on behalf of clients"
Said another way, money managers are big traders (for example, hedge funds) speculating in gold futures.
Further, I divide these traders into two groups:
The bulls - money managers betting on higher gold prices taking a long position in gold futures The bears - money managers betting on lower gold prices taking a short position in gold futuresFinally, the entire analysis of the COT reports is focused on answering just one, crucial question: "Who controls the market?" So, let me see who controls the market now.
Short squeeze in gold futures?
According to the breakthrough COT report, over the week that ended on December 4, the bulls increased their bullish bets by 19.4 thousand contracts. Interestingly, it was the highest increase since the beginning of 2018 when, during the week that ended on January 9, the bulls added 47.7 thousand contracts. What happened then? Over the next five weeks, gold prices went up from $1,314 per ounce to $1,356 (an increase of 3.2%).
And what did the bears do? They were even more active than the bulls, cutting their bearish bets by 29.2 thousand contracts. What is more, the total open interest in gold futures went sharply down from 442.8 thousand contracts on November 27 to 399.9 thousand on December 4 (a drop of 9.7%). Such a pattern (gold prices going strongly up, short sellers leaving the market en masse, and the total open interest going strongly down) is called a short squeeze. If I am correct and the gold market has just entered a short squeeze stage, we should see higher prices of gold soon.
What about silver?
However, there is a problem - the silver has not broken up yet. In other words, during a healthy bull market in precious metals, the gold and silver prices go up in tandem (or, better said, silver goes up faster than gold). Today, it is not the case so I am a bit cautious. Interestingly, according to the latest COT report, the traders in silver futures were generally inactive. During the week that ended on December 4:
The bears cut their bets by 8.0 thousand contracts The bulls added a mere 1.2 thousand contractsAs a result, the situation is a bit complicated - the gold looks like being in an initial bull cycle, but the silver is still in its medium-term consolidation phase.
And what about gold mining ETFs?
If the metals draw a mixed picture, why not to look at the largest gold mining ETF, GDX:
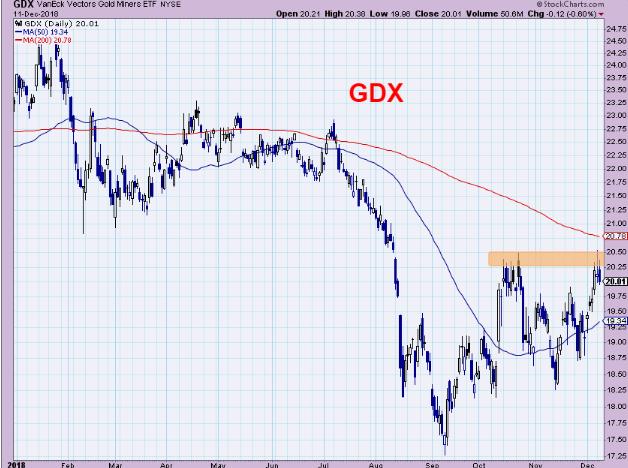
Source: Stockcharts
As the chart above shows, a price pattern drawn by GDX is similar to that drawn by the silver - since middle October 2018, GDX has made two attempts to break above $20.25-20.50 a share, a short-term resistance level. And both attempts have failed.
However, in my opinion, despite these technical problems, GDX is building its strength. Look at this chart:
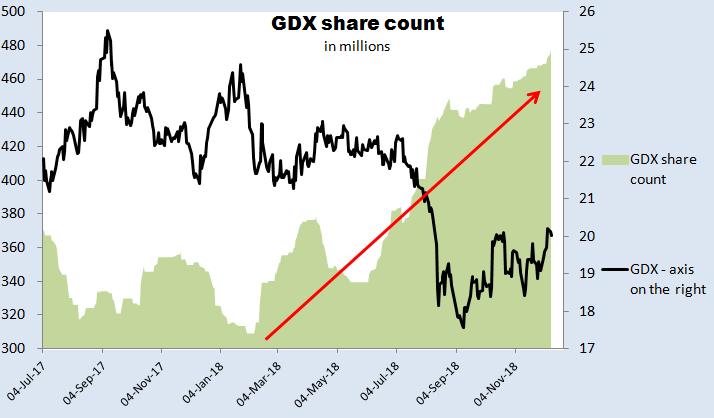
Source: Simple Digressions and the GDX data
The chart shows the GDX share count, a very helpful indicator measuring investors' interest in taking a long position in gold mining shares. Although it is difficult to put an accurate interpretation, a rising share count is interpreted as a growing investors' interest in getting involved in the precious metals market. And, as the red arrow indicates, since middle February 2018, the GDX share count has gone sharply up from 309 million shares to 478 million (an increase of 54.7%). What is more, the highest accumulation took place at pretty low GDX prices - it looks like the so-called "Strong hands" took the opportunity (low prices) increasing their involvement in GDX. If I am correct, and the strong hands have done what I am writing about, we should see higher GDX prices going forward.
Conclusion
Summarizing - the precious metals market looks like a mental puzzle now:
Gold has broken up in an impressive way - the breakout is supported by the COT data Silver is still in a consolidation phase GDX, one of the most popular gold mining ETFs, cannot break above its short-term resistance level at $20.5 a share; on the other hand, a rising share count may be interpreted as bullish in the medium termAs a result, I am cautiously optimistic. Although the gold has broken up, it is currently trading between the two important lines: the 50 and 200-day moving averages. The same pattern is visible on the GDX price chart. I am not a big fan of technical analysis, but, very often, these moving averages work as important resistance/support levels for gold or GDX. As a result, as long as the silver and GDX are not above their short-term resistance ($14.8-15.0 per ounce for silver and $20.5 a share for GDX), I would opt for gold prices fluctuating between these two averages. In other words, I do not expect a vicious bull market in gold just now.
Disclosure: I am/we are long CEF, GDX, KL, SAND, ARREF. I wrote this article myself, and it expresses my own opinions. I am not receiving compensation for it (other than from Seeking Alpha). I have no business relationship with any company whose stock is mentioned in this article.
Follow Simple Digressions and get email alerts