Gold Yield
In recent articles, I have suggested that the low historical returns of gold and its high variability make it a poor long-term investment despite its negative correlation with stocks.
Gold has seen periods of episodic strength, especially in risk-off environments. If Gold is to be used tactically, how should investors think about its relative valuation?
This article discusses the merits of the "Gold Yield", a measurement of the trailing twelve month earnings of the S&P 500 per an ounce of gold.
In an Editor's Pick article published on Monday, I showed rolling returns for Gold (GLD), the S&P 500 (SPY), and a long duration Treasury Index (TLT) over 1, 3, 5, 10, 20, and 30-year time horizons for a dataset dating back to the early 1970s. As time horizons extended, Gold was less likely to outperform stocks and bonds.
Over shorter time intervals, there were periods when Gold did very well, particularly in risk-off environments for stocks. For me, this analysis suggests that Gold is best used as a tactical instrument in downturns, but given its long-run underperformance it is an expensive structural hedge for your portfolio.
If an investor wanted to position tactically in Gold, then they would need a relative value framework. Drawing on my long time series for spot gold and the S&P 500, I began working to build a relative value framework by plotting an ounce of gold versus the index value of the S&P 500.
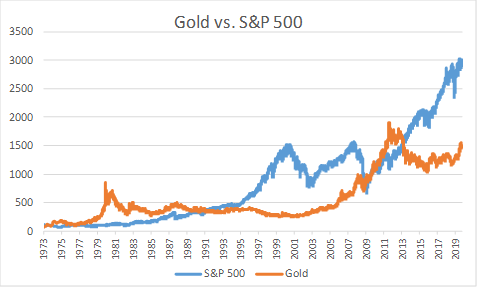 I then decided to look at how many units of the S&P 500 index an ounce of gold could buy over time. Today, gold is just under $1500/oz and the S&P 500 is just over 3,000 points, so an ounce of gold would buy roughly 0.5 a unit of the index. Over this four-plus decade horizon, that figure has ranged from less than 0.2 in 1999 to more than 7.6 in 1980.
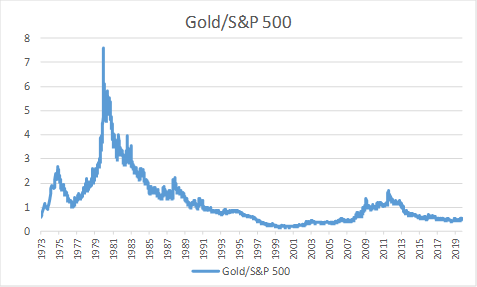 That analysis started to become a little more interesting. The limited amount of S&P 500 that could be bought for an ounce of gold in 1999 was a sign that stocks were stretched. Similarly, gold could buy a lot of stocks in 1980, just before stocks would kick off a generation of low teens annualized returns through the 1980s and 1990s.
I decided to extend that analysis by bringing in the historical earnings of the S&P 500. Instead of looking at how much of the S&P 500 index an ounce of gold could buy, I examined how much in trailing earnings an ounce of gold would procure over time. I call this the "Gold Yield" - trailing twelve month earnings for the S&P 500 divided by the price of gold.
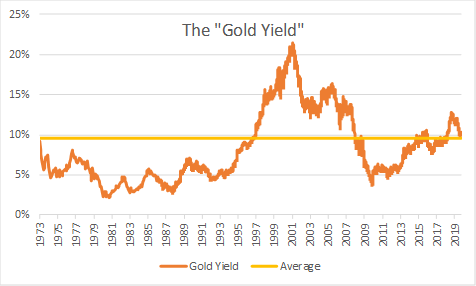 The "Gold Yield" hit its historic low on September 30th, 1980 at 2.2%. On that day Gold was trading at $667/ounce. The metal would not hit that level again until May 2006. Over that 26-year period, Gold returned zero to investors. Owners of the S&P 500 returned an above trend 12.8% per annum, growing their money more than 20-fold.
On the flip side, Gold had its highest "yield" on February 15th, 2001 at 21.1%. On that day, Gold was trading at $256/oz. Trailing S&P 500 earnings were $54.80. From that day, stocks would fall nearly 30% before bottoming in October 2002. From mid-February 2001 through mid-November 2005, investors in the S&P 500 produced a total return of zero while Gold climbed more than 80% to $470/oz.
The recent low in the "Gold Yield" happened in late 2009. Gold was then at around $1200/oz, so it is up just under 25%, but that is just a 2% annualized return over the last decade. Conversely, the S&P 500 has returned about 13% per annum over that period.
Today, the "Gold Yield" is just over 10% with Gold just under $1500/ounce and trailing twelve month S&P 500 earnings at just over $150. This is modestly above the historical average of 9.5% for the "Gold Yield". To me, that probably signals that Gold is fairly valued relative to stocks. This was an interesting exercise for me, and I hope this relative value framework proves a useful tool for Seeking Alpha readers.
Disclaimer: My articles may contain statements and projections that are forward-looking in nature, and therefore, inherently subject to numerous risks, uncertainties, and assumptions. While my articles focus on generating long-term risk-adjusted returns, investment decisions necessarily involve the risk of loss of principal. Individual investor circumstances vary significantly, and information gleaned from my articles should be applied to your own unique investment situation, objectives, risk tolerance, and investment horizon.
Disclosure: I am/we are long SPY. I wrote this article myself, and it expresses my own opinions. I am not receiving compensation for it (other than from Seeking Alpha). I have no business relationship with any company whose stock is mentioned in this article.
Follow Ploutos and get email alerts