Have Commodities Peaked? We Doubt It / Commodities / Commodities Trading

While everyone was paying attention to the FOMC, Gold & Silver, and the Treasury Yields, it appears the recent commodity rally trend took a big hit on Thursday, March 18, 2021. Our guess is that the FOMC statement did nothing to support the continued commodity price rally as the US Fed continued with near-zero interest rates and economic support through 2023. The rally in commodities was likely based on expectations of a much stronger economic recovery as the COVID vaccines take the pressure off economic shutdowns and further restrictive economic conditions, but that may not be the case.
Commodities Rollover May Be Misleading Traders
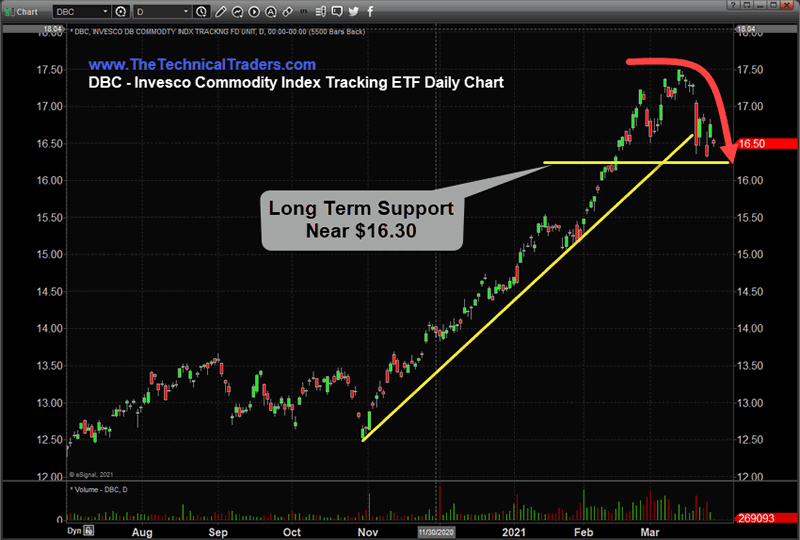
The rollover in commodities suggests the markets are reacting to renewed expectations, post-FOMC. They may continue to consolidate near support (near $16.30) before attempting to move higher as traders digest the Fed comments and fall back into economic recovery expectations. Any move below $16.00 as seen on the chart below may likely prompt a consolidation phase within historical support channels (see the Weekly DBC chart below).
Commodities Attempting to Base Near Support
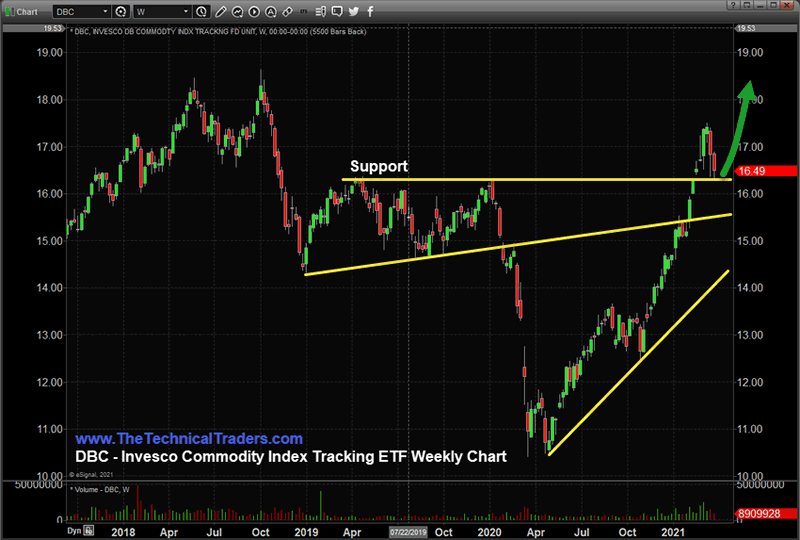
The following weekly DBC chart shows how the COVID-19 event collapsed commodity prices and how they’ve just recently rallied back to levels above the pre-COVID price range – above $15.00. When we start to look at longer-term trends, we start to see a number of key price levels that become important technical factors related to future trends. The support levels that setup in 2019, pre-COVID, are still very valid current support levels for commodities. If a continued economic recovery takes place, DBC will likely find support above $15 and then begin another rally phase targeting prices above $19 to $20. This current rollover in commodity prices may be nothing more than a pause in price before another rally starts.
Commodities Break Major Monthly Price Channel
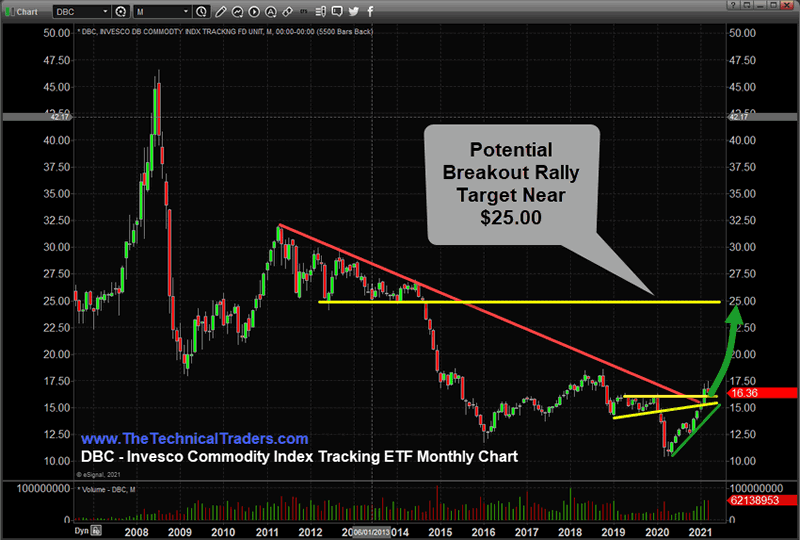
Lastly, looking at the Monthly DBC chart, below, highlights the very long-term price trends and what becomes immediately evident is that price has recently broken above the RED downward sloping price channel line. The momentum of the price rally that recently broke this downward price channel was strong enough to pierce this downward sloping channel – and it would not be uncommon for price to pause after this price breach. The YELLOW support levels, from the weekly DBC chart, continue to confirm the $15 to $16 as active support. Any price rotation or pause near this level will likely hold within this support range before attempting another move higher.
Be sure to sign up for our free market trend analysis and signals now so you don’t miss our next special report!
We targeted price lows from 2012~2014 as a potential upside price target if the rally phase continues. After breaking the major downward sloping price trend, it is very likely that once DBC prices rally above $18.50, a continued rally phase may target the $25 price level with an extended run over many months.
Historically, a rally in commodities does not always prompt a rally in the US major indexes. In 2007~08, commodities rallied extensively while the US stock market collapsed. In 2010~11, commodities rallied as the US stock market rallied more than 27%. In 2016~2018, commodities rallied as the US stock market rallied more than 62%. The current breakout above the RED longer-term price channel suggests we may see a stock market rally aligned with a commodity price rally based on the recent comments by the US Fed. Unless a major credit market or other catastrophic event takes place, we believe this upward trend in commodities may prompt an extended recovery rally in both commodities and the US stock market.
Don’t miss the opportunities in the broad market sectors over the next 6+ months. 2021 and beyond are going to be incredible years for traders. What we expect to see is not the same type of market trend that we have experienced over the past 8+ years – this is a completely different set of market dynamics. You can sign up now for my FREE webinar that teaches you how to find, enter, and profit from only those sectors that have the most strength and momentum. Staying ahead of sector trends is going to be key to success in volatile markets.
For those who believe in the power of trading on relative strength, market cycles, and momentum but don’t have the time to do the research every day then my BAN Trader Pro newsletter service does all the work for you with daily market reports, research, and trade alerts. More frequent or experienced traders have been killing it trading options, ETFs, and stocks using my BAN Hotlist ranking the hottest ETFs, which is updated daily for my premium subscribers
Chris Vermeulen
www.TheTechnicalTraders.com
Chris Vermeulen has been involvedin the markets since 1997 and is the founder of Technical Traders Ltd. He is an internationally recognized technical analyst, trader,and is the author of the book: 7 Steps to Win With Logic
Through years ofresearch, trading and helping individual traders around the world. He learnedthat many traders have great trading ideas, but they lack one thing, theystruggle to execute trades in a systematic way for consistent results. Chrishelps educate traders with a three-hourvideo course that can change your trading results for the better.
His mission is to help hisclients boost their trading performance while reducing market exposure andportfolio volatility.
He is a regularspeaker on HoweStreet.com, and the FinancialSurvivorNetwork radio shows. Chriswas also featured on the cover of AmalgaTrader Magazine, and contributesarticles to several leading financial hubs like MarketOracle.co.uk
Disclaimer: Nothing in this report should be construed as a solicitation to buy or sell any securities mentioned. Technical Traders Ltd., its owners and the author of this report are not registered broker-dealers or financial advisors. Before investing in any securities, you should consult with your financial advisor and a registered broker-dealer. Never make an investment based solely on what you read in an online or printed report, including this report, especially if the investment involves a small, thinly-traded company that isn’t well known. Technical Traders Ltd. and the author of this report has been paid by Cardiff Energy Corp. In addition, the author owns shares of Cardiff Energy Corp. and would also benefit from volume and price appreciation of its stock. The information provided here within should not be construed as a financial analysis but rather as an advertisement. The author’s views and opinions regarding the companies featured in reports are his own views and are based on information that he has researched independently and has received, which the author assumes to be reliable. Technical Traders Ltd. and the author of this report do not guarantee the accuracy, completeness, or usefulness of any content of this report, nor its fitness for any particular purpose. Lastly, the author does not guarantee that any of the companies mentioned in the reports will perform as expected, and any comparisons made to other companies may not be valid or come into effect.
Chris Vermeulen Archive |
© 2005-2019 http://www.MarketOracle.co.uk - The Market Oracle is a FREE Daily Financial Markets Analysis & Forecasting online publication.