Healthy Consolidation In Gold
Gold corrected from the early September high.
Trading in a range since the recent bottom.
The short-term chart is looking neutral.
Lower rates, Brexit, and trade support gold.
A higher high before the end of 2019 - gold mining stocks should outperform gold on a percentage basis.
Gold has been in the spotlight since June when it broke out to the upside above its critical resistance level at the July 2016 high of $1377.50 per ounce. That price stood as a line in the sand on the upside for the precious metal for almost three years before it finally gave way. The price rallied on the back of falling interest rates in the US and around the world. The escalation of the trade war between the US and China was also a supportive factor.
Another issue that pushed the price of gold to the upside has been the ongoing saga of the UK's divorce from the European Union. Gold rallied to its high at $1377.50 in July 2016 on the back of the shock of the Brexit referendum in the United Kingdom. Gold is a barometer of fear and uncertainty in the world, as well as inflationary pressures. While inflation remains below the Fed and ECB's 2% target rate, it may be just a matter of time before accommodative monetary policy and historically low rates cause inflation to return with a vengeance.
Since moving about the $1377.50 level in June, gold has never returned to that level. On the continuous contract, the closest it came during the recent correction was when it fell just below the $1460 per ounce level. Gold was trading at the $1485 level on October 30 as the price continues to consolidate. If gold is heading for higher heights over the coming weeks and months, shares of gold mining companies are likely to outperform the price appreciation in the gold futures market on a percentage basis. The VanEck Junior Gold Miners ETF product (GDXJ) holds shares in many of the leading junior gold mining companies. When gold rallies, junior gold mining shares can experience explosive moves on the upside.
Gold corrected from the early September high
After reaching a high at $1559.80 on the continuous futures contract on September 4, the price of gold corrected to the downside.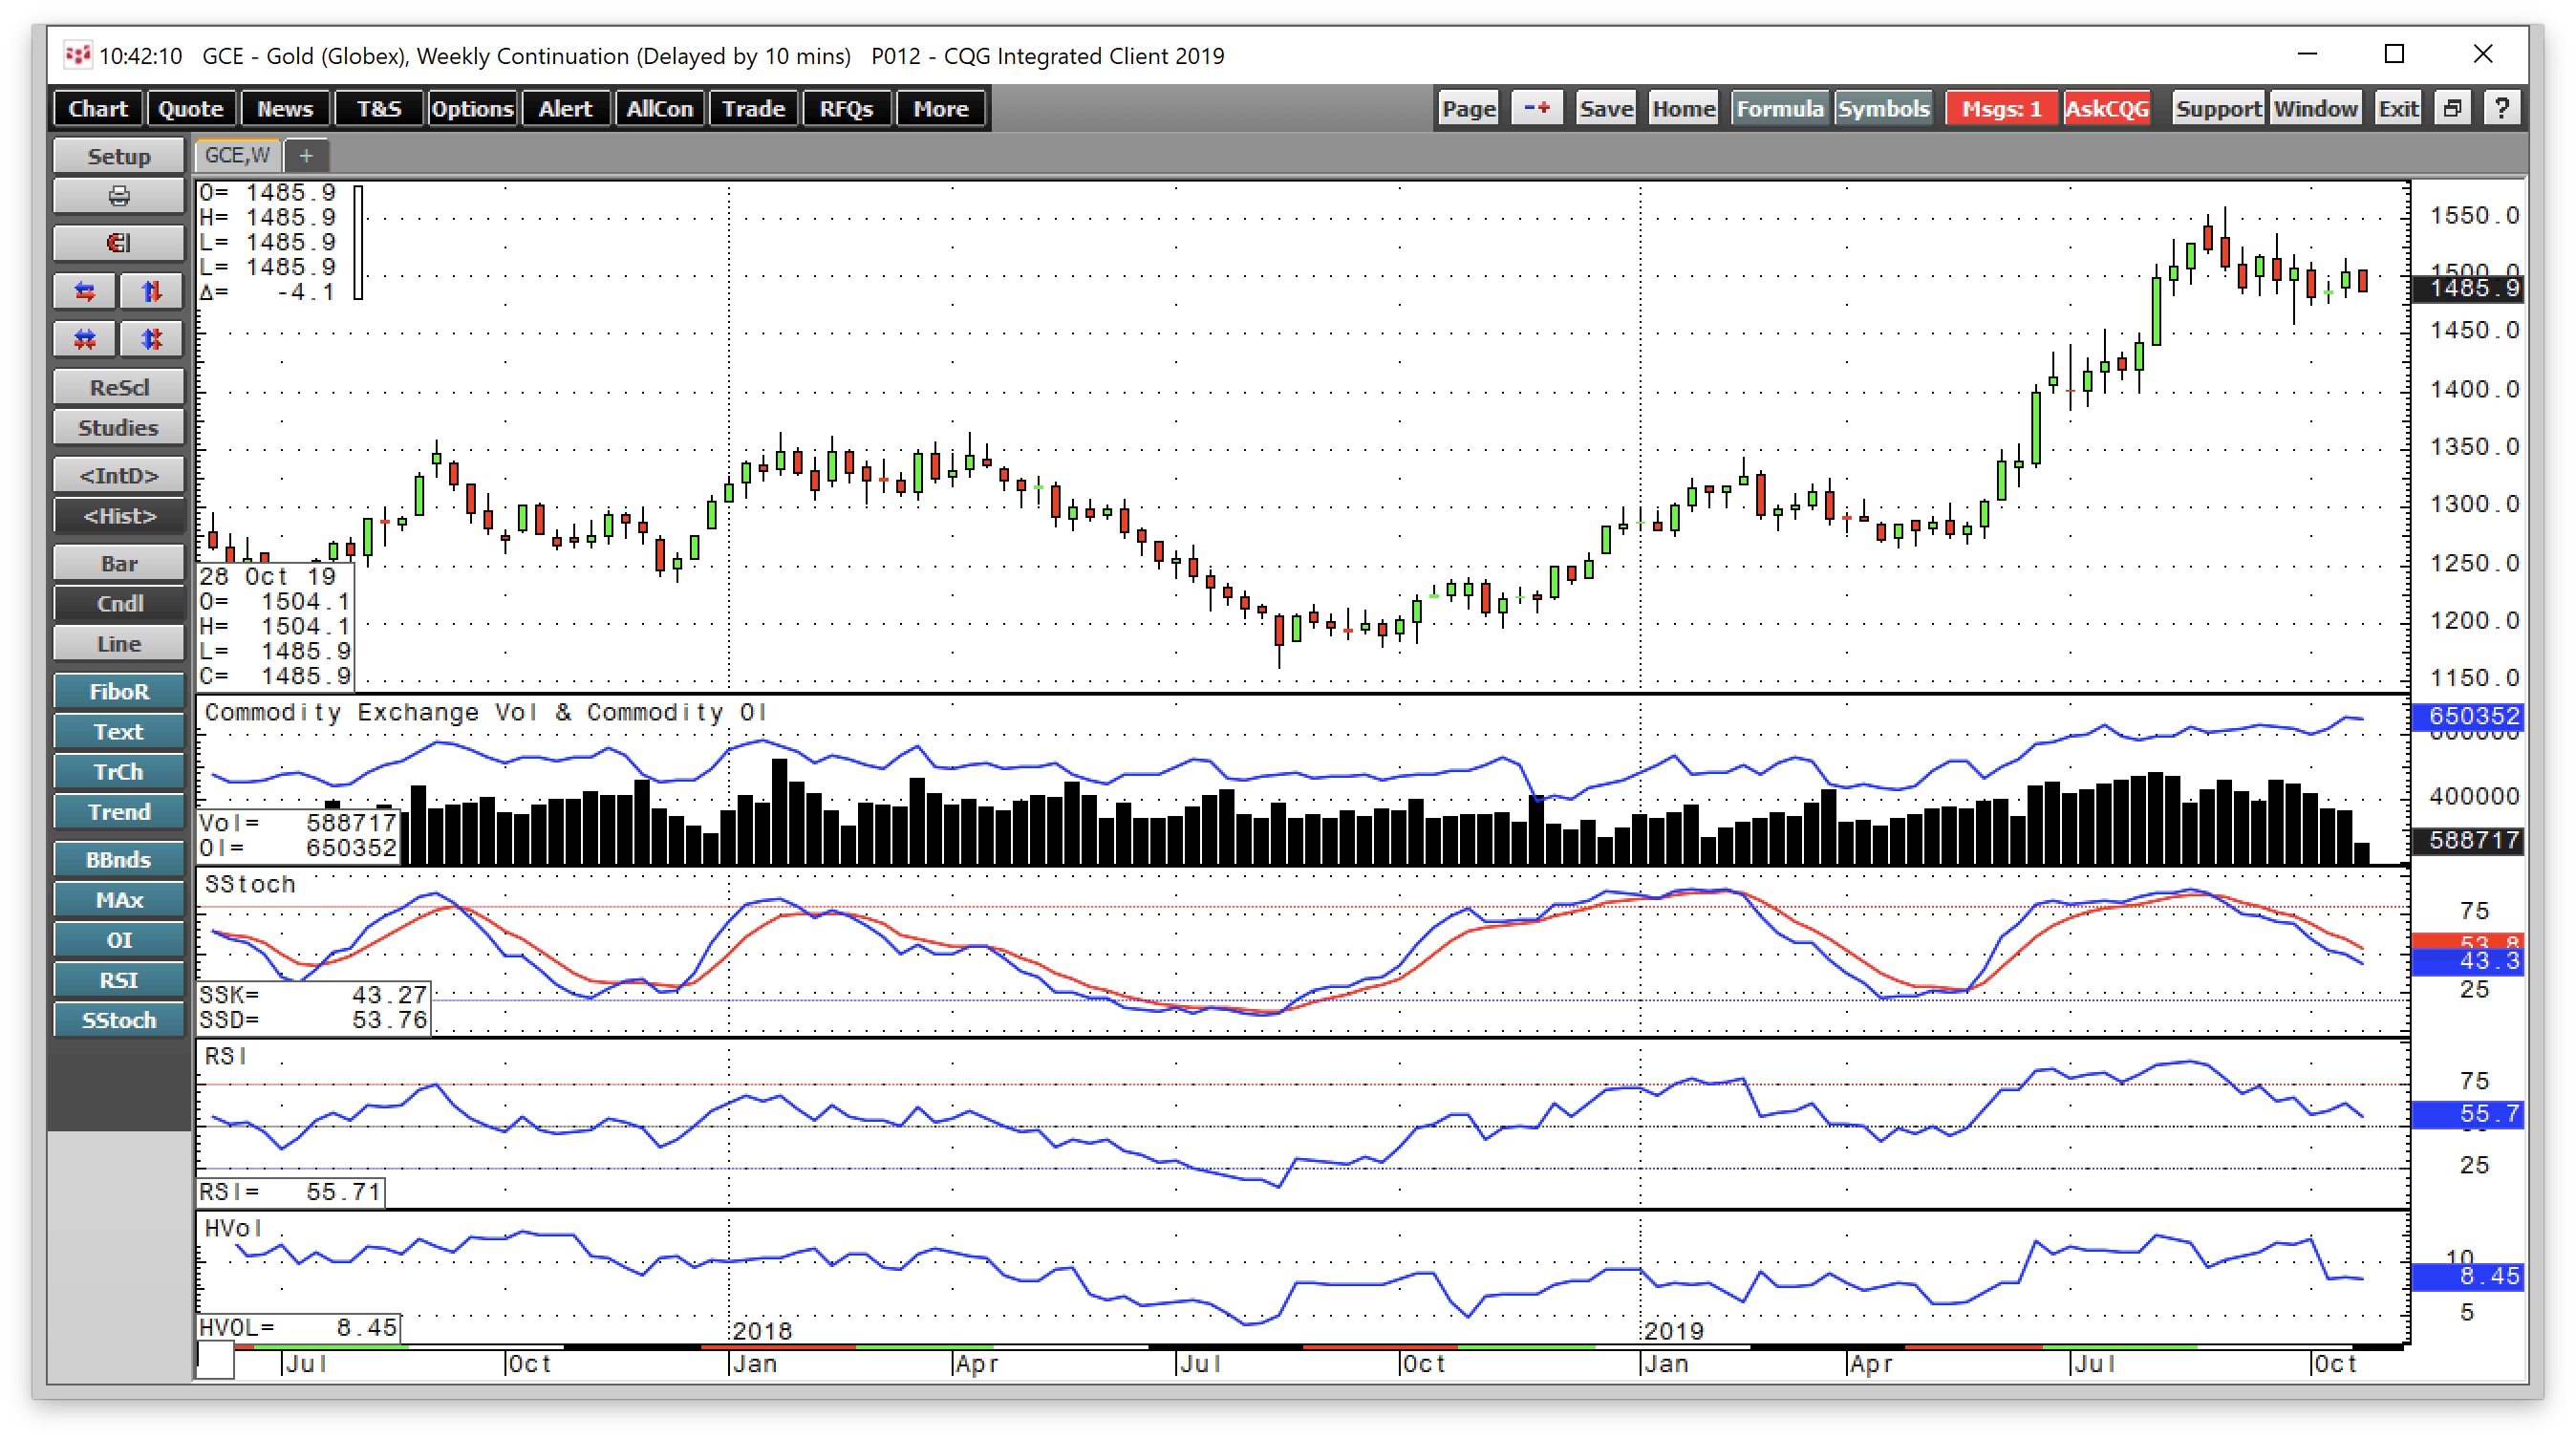
Source: CQG
The weekly chart shows that nearby gold futures corrected to a low at $1458.30 during the week of September 30. Since then, the price has been trading on either side of $1500 per ounce. The correction alleviated the overbought condition in the price momentum indicator, which has declined below neutral territory. Relative strength was at just over a neutral reading as of October 30, and weekly historical volatility declined from 12.28% in early October to 8.45%. Open interest, the total number of open long and short positions in the COMEX gold futures market was at 650,352 contracts, close to a record high, as of October 29. On Tuesday, October 29, the active month December futures contract was at the $1490 level.
Trading in a range since the recent bottom
The weekly chart shows that since the week of October 7, gold has traded in a narrow range between $1476.60 and $1514.30 with a midpoint at $$1495.45 per ounce.
The midpoint of the trading range from the early September highs to the early October low stands at $1509.05.
Gold was consolidating at the start of the week of October 28, as the yellow metal continues to digest the rally from the April 2019 low at $1266 to the early September high. The upward trajectory of the gold market ran out of buying at just below the $1560 level, which was the highest price for the precious metal since 2013. At the same time, the price of gold has not moved anywhere near the breakout level from June at $1377.50, which has become critical technical support for the yellow metal.
The short-term chart is looking neutral
The active month December futures contract at the $1490 per ounce level on October 29 offered few clues about price direction.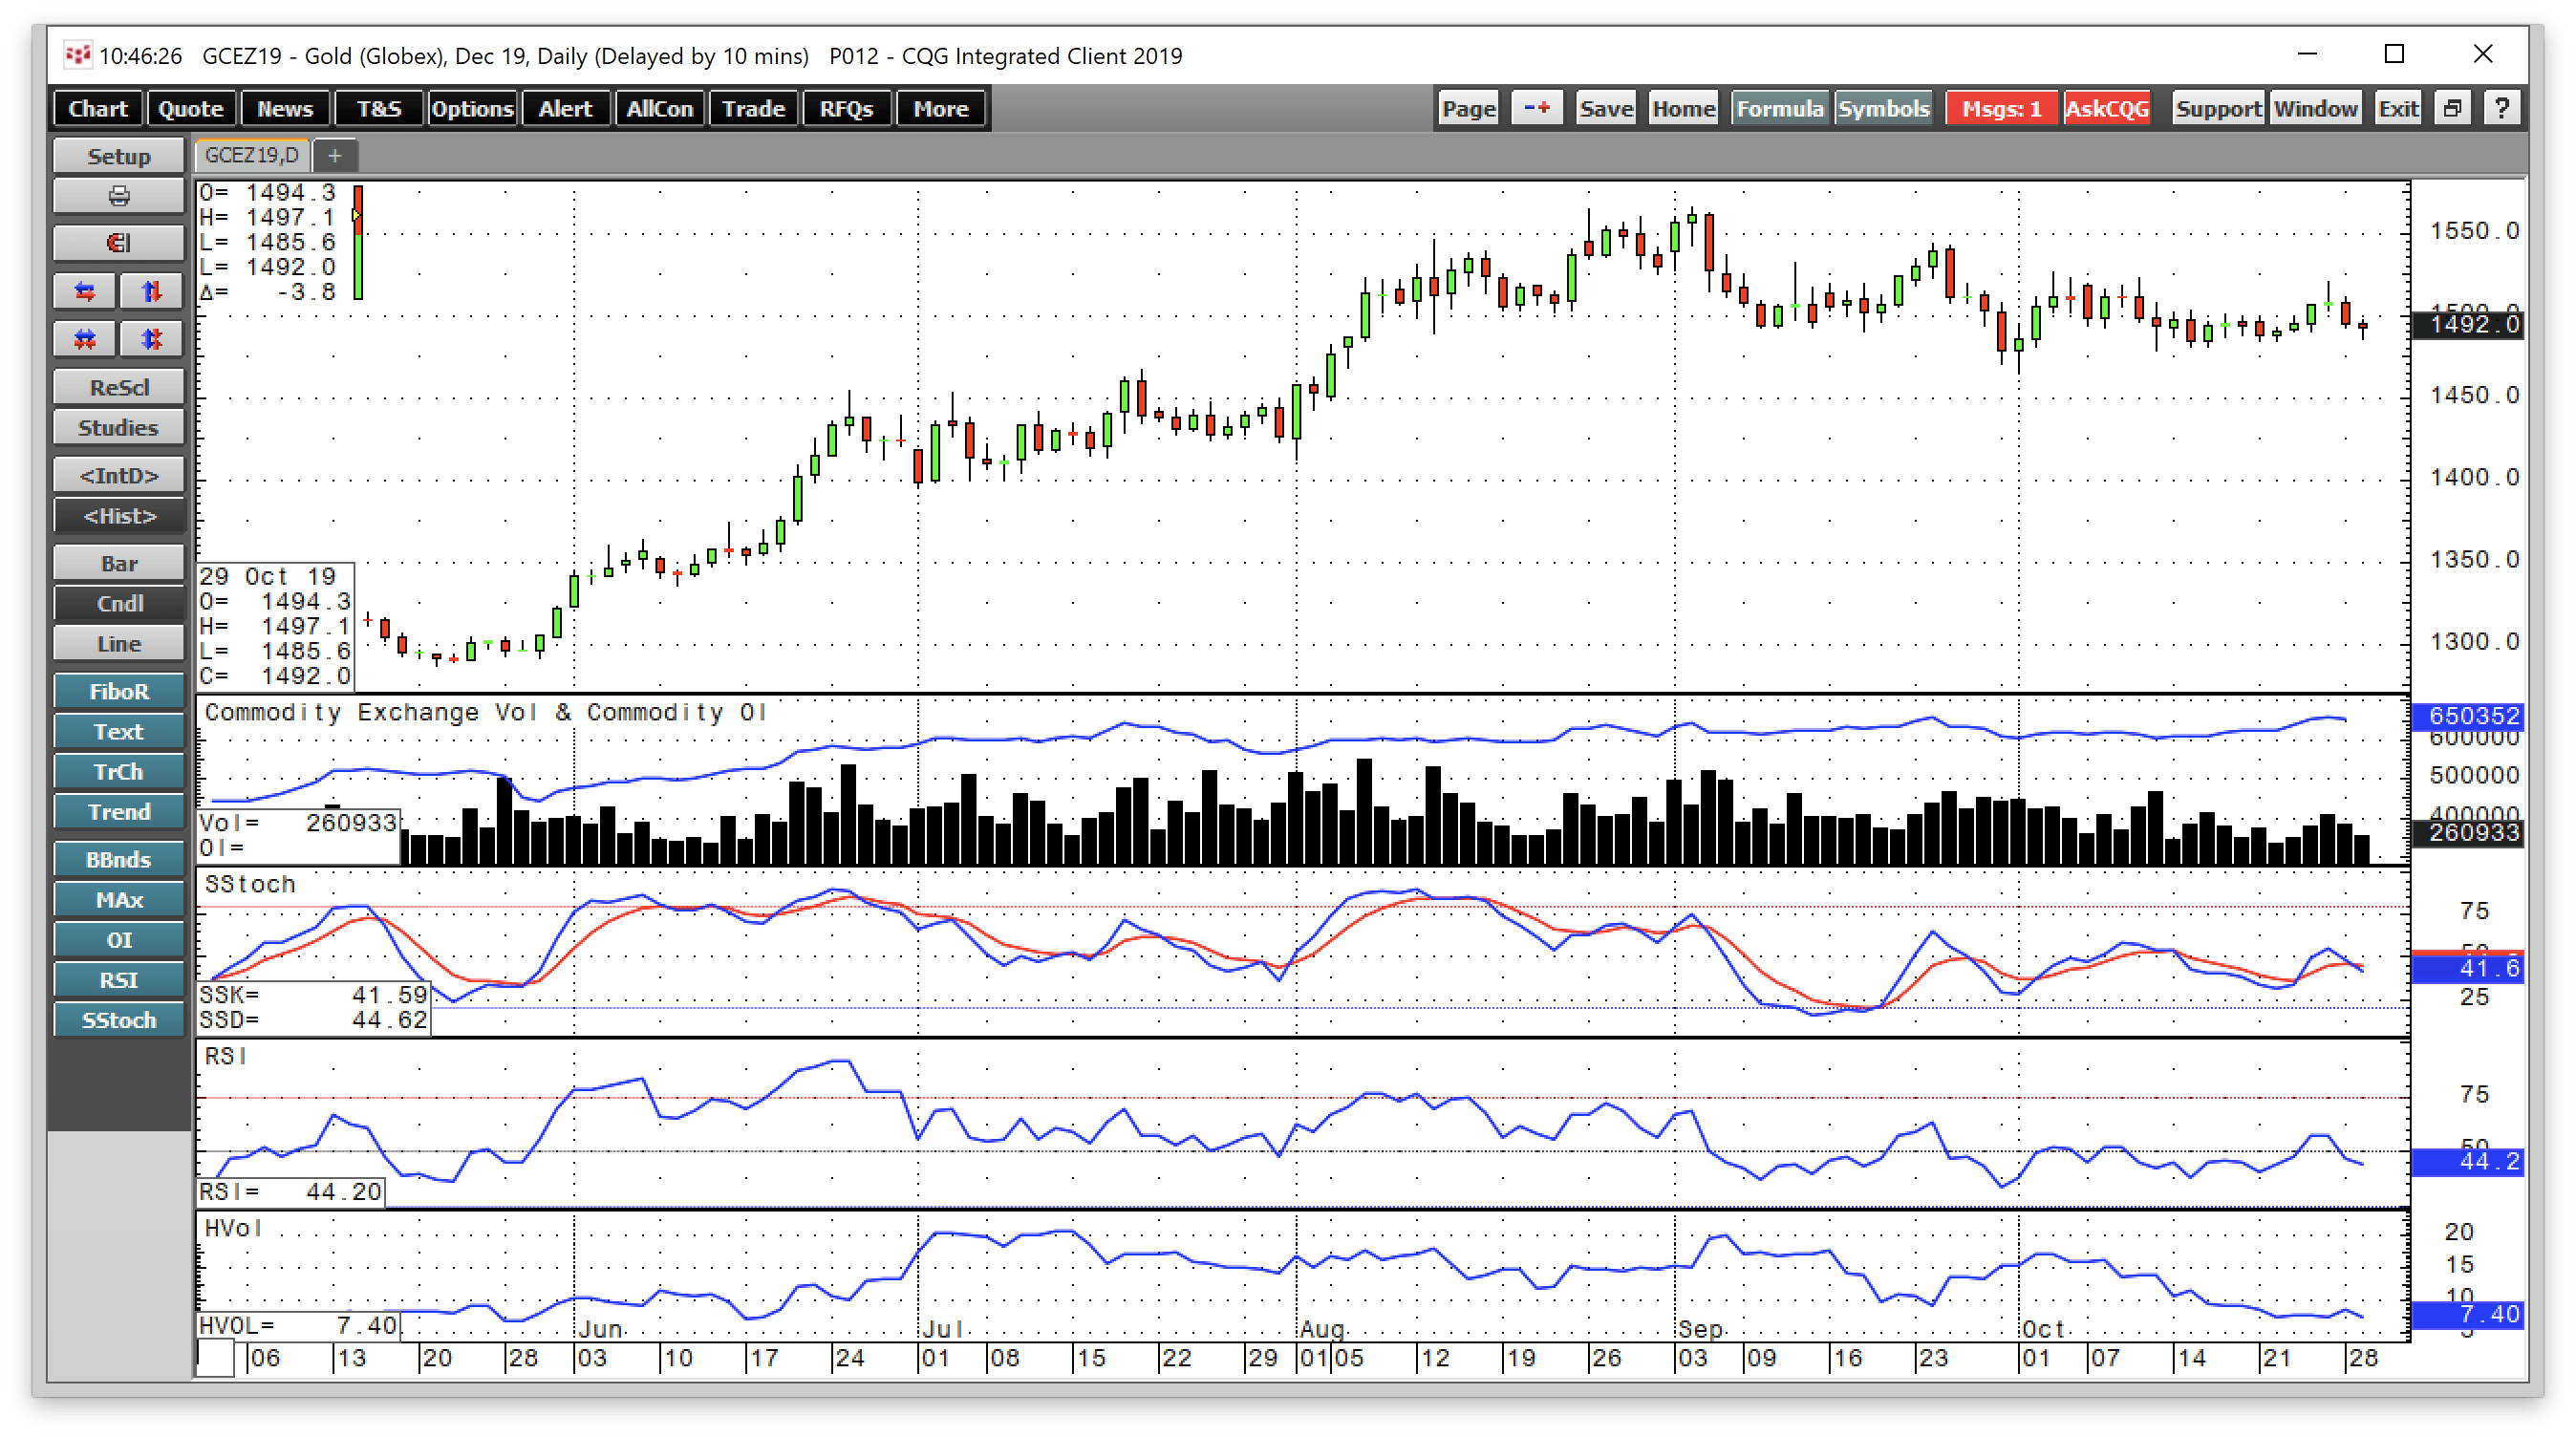
Source: CQG
December futures have traded in a range from $1465 to $1566.20 since the beginning of September with a midpoint at $1515.60 per ounce. At the $1490 level, gold continued to lean lower. Both price momentum and relative strength indicators on the short-term chart were slightly below neutral readings on the daily chart. The gold market is sitting and waiting for the next piece of news that will drive the price towards the top or bottom end of its trading range over the past two months.
Lower rates, Brexit, and trade support gold
The primary issues driving all markets these days were responsible for gold's move above its technical resistance level back in June. The escalation of the trade war between the US and China caused fear and uncertainty in markets across all asset classes. Gold benefited from the geopolitical and economic landscapes created by protectionist policies that threaten a global recession.
Brexit has been a factor that has underpinned the gold price since the June 2016 referendum. The shock of the UK's vote to exit the European Union sent gold to its previous high at $1377.50 per ounce. The inability to reach a deal for the divorce over the past weeks and months was one of the reasons for gold to rise above the July 2016 high. As of October 28, the only thing sure about Brexit was another extension for the UK to the end of January.
Perhaps the most significant factor causing gold to shine these days has been the trend in global interest rates. The US Federal Reserve stopped increasing the short-term Fed Funds rate in December 2018. In early 2019, the central bank canceled projected rate hikes for 2019. In June, the Fed told markets that short-term rates would decline. On July 31, the FOMC cut the Fed Funds rate by 25 basis points for the first time in years and ended its balance sheet normalization program early. The quantitative tightening had been pushing rates higher further out along the yield curve to reduce the Fed's swollen balance sheet, which was a legacy of years of quantitative easing. In September, the Fed pulled the trigger again and cut the Fed Funds rate by another 25 basis points. At the same time, the European Central Bank also cut its deposit rate in September by ten basis points to negative fifty points. The ECB went a step further when it announced that it would restart its quantitative easing program with purchases of government and high-quality corporate debt securities in November 2019.
The trend of falling interest rates around the world has sent the price of gold to new highs in most currencies. Over the past months, gold in euros, British pounds, Canadian and Australian dollars, Russian rubles, Chinese yuan, and many other foreign exchange instruments moved to new record highs. In Swiss franc and US dollars, the yellow metal remained below its all-time peaks, but the trend in both currencies has been higher. The current sideways trading in the gold market in dollar terms could be a healthy sign. The issues that pushed gold higher over the past months continue to support the price of the yellow metal.
Today, on October 30, the FOMC meets again to decide on the path of monetary policy for the coming month. The vast majority of market participants expect the Fed to lower the Fed Funds rate by another 25 basis points at the October meeting. On Tuesday, October 29, gold was waiting to hear the verdict from the US central bank.
A higher high before the end of 2019 - gold mining stocks should outperform gold on a percentage basis
Markets rarely move in a straight line. Even the most aggressive bull markets pause and consolidated before making further gains.
Commodities can be highly volatile assets, but gold is a hybrid between a commodity and a currency. Foreign exchange instruments tend to experience far lower levels of price variance than commodities. I continue to believe that when the current consolidation period ends, gold will move to higher highs. I expect that we could see the price of the yellow metal rise above the $1560 level and to $1600 by the end of this year. If global interest rates continue to fall, trade between the US and China remains an issue, and the Brexit issue crawls like a snail, the reasons for gold's ascent will remain intact.
If gold is heading higher, gold mining stocks are likely to outperform the yellow metal on a percentage basis. Junior gold mining shares often rise faster than the senior miners during rallies.
The VanEck Junior Gold Miners ETF product holds many of the leading junior gold mining shares. The product offers investors and traders the opportunity to own a diversified portfolio of the junior miners, which mitigates some of the risks of holding individual mining shares. The most recent top holdings of GDXJ include: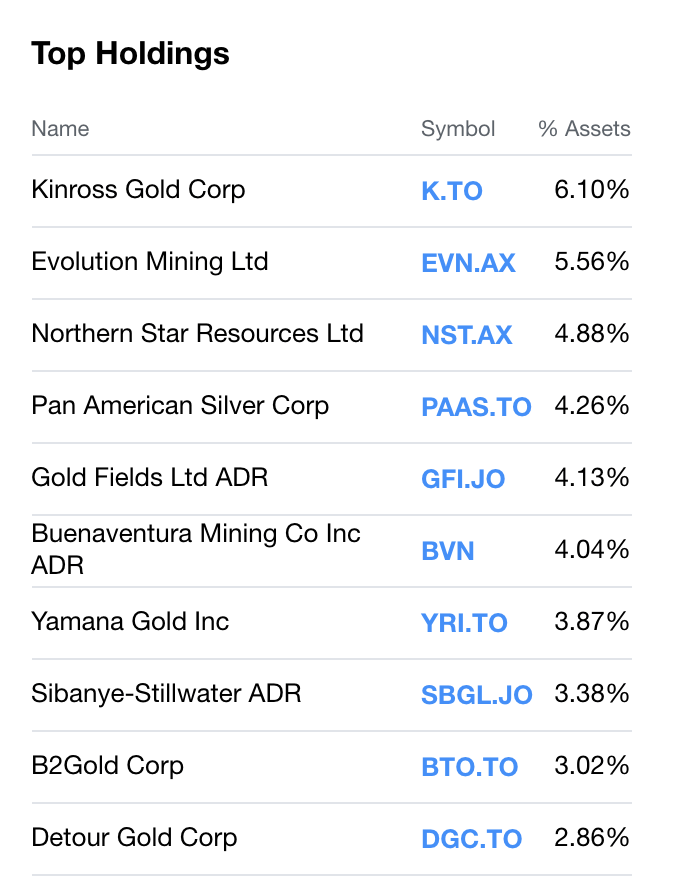
Source: Yahoo Finance
GDXJ is a highly liquid product with $4.18 billion in net assets, and over 17.6 million shares changing hands each day. The ETF charges an expense ratio of 0.54%. GDXJ is not a leveraged product, so it is appropriate for longer-term forays into the gold mining shares compared to the leveraged instruments that suffer from time decay. However, GDXJ acts like a leveraged instrument as it tends to outperform gold on a percentage basis on the upside and underperform on the downside. The price of gold rose from $1266 in April to a high at $1559.80 in early September, a rise of 23.2%. The price then corrected to a low at $1458.30 in early October, a fall of 6.51%.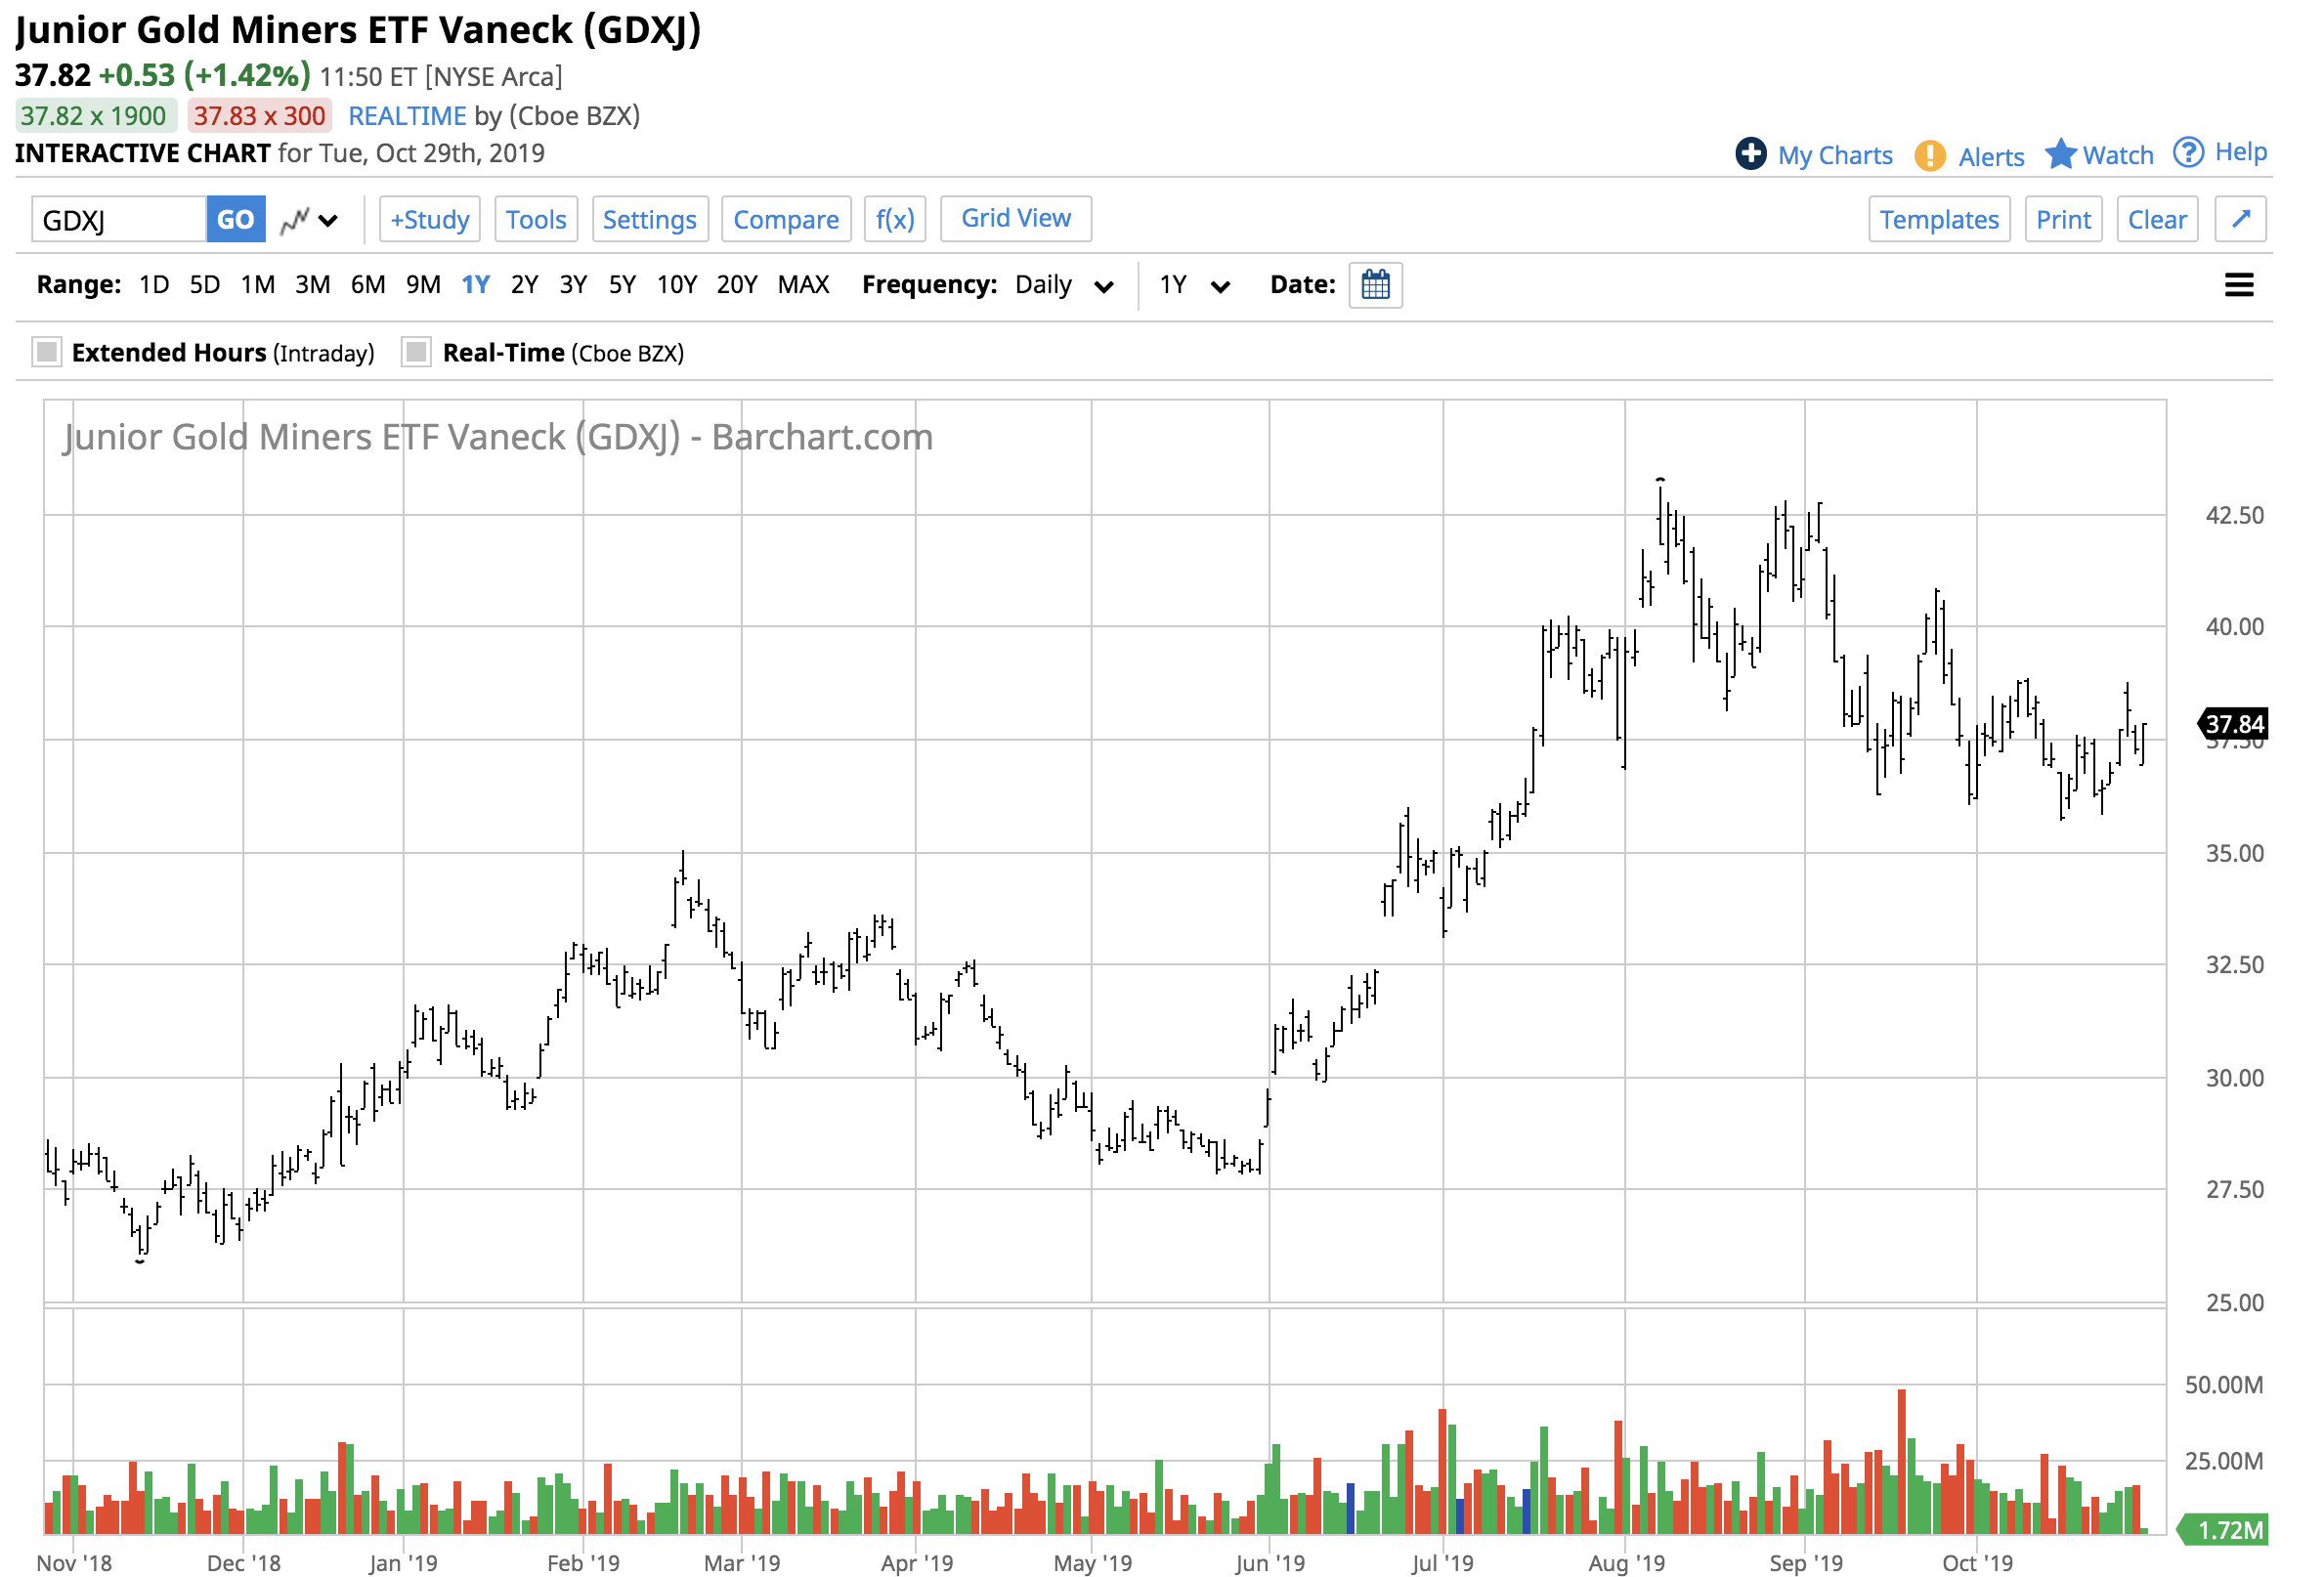
Source: CQG
The chart shows that GDXJ waited until late May to move from its low at $27.80 to a high at $43.10 in August, a rise of over 55%. Since the high, GDXJ fell to a low at $35.69 in mid-October, a decline of 17.2%. The product rose by over double the move in the gold futures market on a percentage basis and fell by more than twice the percentage level during the correction. At $37.82 per share on October 29, GDJX is also consolidating and waiting for the price of gold to move.
I believe the current period of consolidation in the gold market is healthy, and that it will give way to higher highs in the coming weeks and months. GDXJ on price weakness is a leveraged way to position on the long side of the gold market. While the product would likely compound losses on the downside, it will not suffer from time decay.
The Hecht Commodity Report is one of the most comprehensive commodities reports available today from the #2 ranked author in both commodities and precious metals. My weekly report covers the market movements of 20 different commodities and provides bullish, bearish and neutral calls; directional trading recommendations, and actionable ideas for traders. I just reworked the report to make it very actionable!
Disclosure: I/we have no positions in any stocks mentioned, and no plans to initiate any positions within the next 72 hours. I wrote this article myself, and it expresses my own opinions. I am not receiving compensation for it (other than from Seeking Alpha). I have no business relationship with any company whose stock is mentioned in this article.
Additional disclosure: The author always has positions in commodities markets in futures, options, ETF/ETN products, and commodity equities. These long and short positions tend to change on an intraday basis.The author is long gold
Follow Andrew Hecht and get email alerts