Here's What's Eating Away at Gold / Commodities / Gold and Silver 2021
Gold is dodging bullets, as it comesincreasingly under fire from rising U.S. interest rates and a USD that ispoised to surge.
Catching unsuspecting traders in yetanother bulltrap , gold’s early-week strength quickly faded. And with investorsunwilling to vouch for the yellow metal for more than a few days, therush-to-exit mentality highlights a short-term vexation that’s unlikely tosubside.
Please see below:
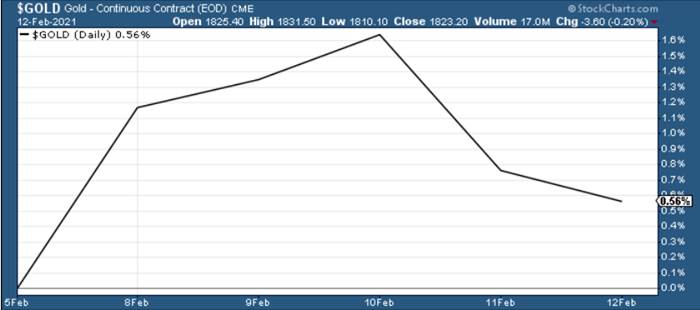
Figure1
Destinedfor devaluation after hitting its triangle-vertex-based reversal point (which Iwarned about previously ), the yellow metal is struggling to climbthe ever-growing wall of worry.
Mirroring what we saw at the beginning ofthe New Year, gold’s triangle-vertex-based reversal point remains a reliableindicator of trend exhaustion.
And when you add the bearish cocktail ofrising U.S. interest rates and a potential USD Index surge, $1,700 remains theinitial downside target , with $1,500 to even ~$1,350 still possibilities under the rightcurcumstances.
Please see below:
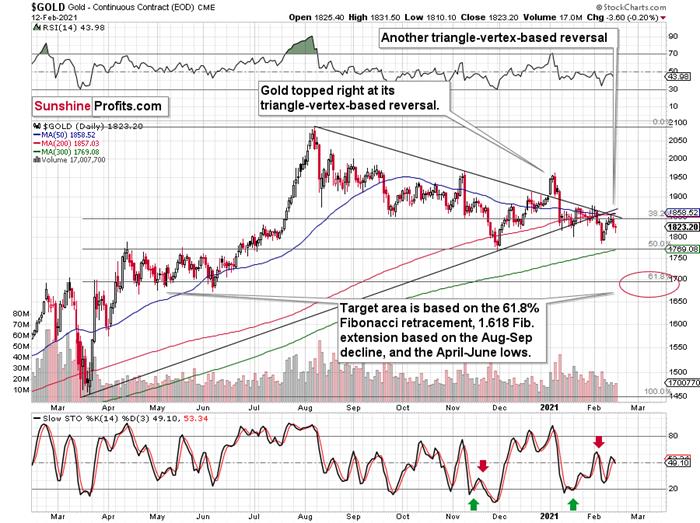
Figure2 - Gold Continuous Contract Overview and Slow Stochastic Oscillator ChartComparison
To explain the rationale, I wrotepreviously:
Backin November, gold’s second decline (second half of the month) was a bit biggerthan the initial (first half of the month) slide that was much sharper. TheJanuary performance is very similar so far, with the difference being that thismonth, the initial decline that we saw in the early part of the month wasbigger.
Thismeans that if the shape of the price moves continues to be similar, the nextshort-term move lower could be bigger than what we saw so far in January andbigger than the decline that we saw in the second half of November. This is yetanother factor that points to the proximity of $1,700 as the next downsidetarget.
In addition, as a steepening U.S. yieldcurve enters the equation, I wrote on Jan. 27 that the bottom, and subsequent move higher, in U.S. Treasury yieldscoincided with a USDX rally 80% of the time since 2003.
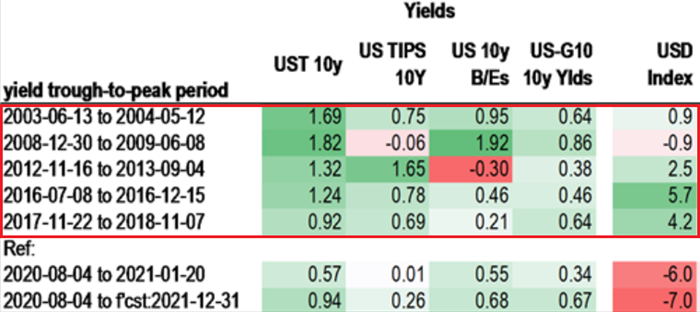
Figure3 - Source: Daniel Lacalle
And while the USDX continues to fighthistorical precedent, on Feb. 12, the U.S. 30-Year Treasury yield closed atits highest level in nearly a year. As such, the move should add wind tothe USDX’s sails in the coming weeks.
Please see below:
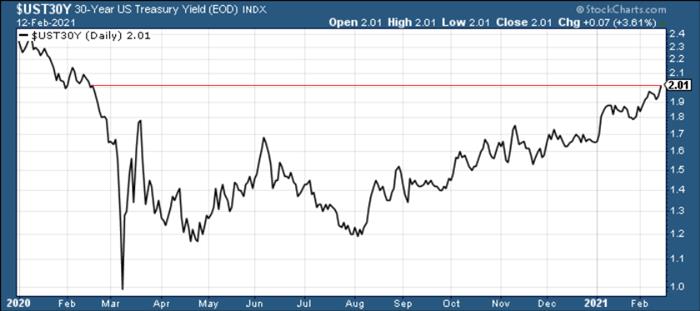
Figure4
In conclusion, gold is under fire fromall angles and dodging bullets has become a near impossible task. With the USDIndex likely to bounce off its declining resistance line (now support), abottom in the greenback could be imminent. Also ominous, a steepening U.S. yieldcurve signals that the yellow metals’ best days are likely in therearview. However, as the situation evolves and gold eventually demonstratescontinued strength versus the USD Index, its long-term uptrend will resume onceagain.
Before moving on, I want to reiterate myprevious comments and explain why $1,700 remains my initial target:
Oneof the reasons is the 61.8% Fibonacci retracement based on the recent 2020rally, and the other is the 1.618 extension of the initial decline. However,there are also more long-term-oriented indications that gold is about to moveto $1,700 or lower.
(…)gold recently failed to move above its previous long-term (2011) high. Sincehistory tends to repeat itself, it’s only natural to expect gold to behave asit did during its previous attempt to break above its major long-term high.
Andthe only similar case is from late 1978 when gold rallied above the previous1974 high. Let’s take a look at the chart below for details (courtesy ofchartsrus.com)
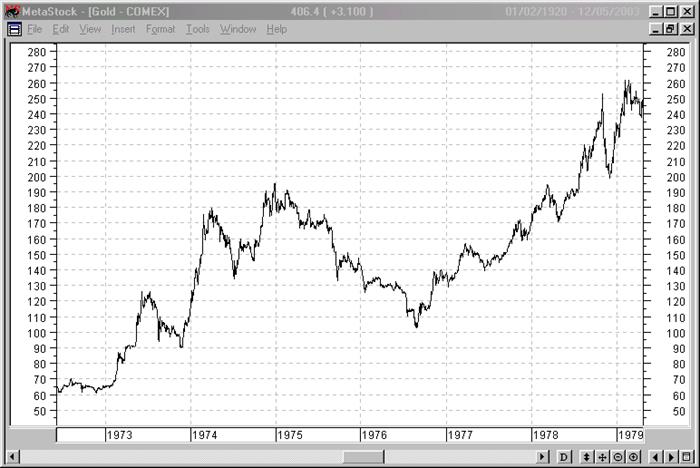
Figure5 - Gold rallying in 1978, past its 1974 high
Asyou can see above, in late 1978, gold declined severely right after it movedabove the late-1974 high. This time, gold invalidated the breakout, which makesthe subsequent decline more likely. And how far did gold decline back in 1978?It declined by about $50, which is about 20% of the starting price. If gold wasto drop 20% from its 2020 high, it would slide from $2,089 to about $1,671 .
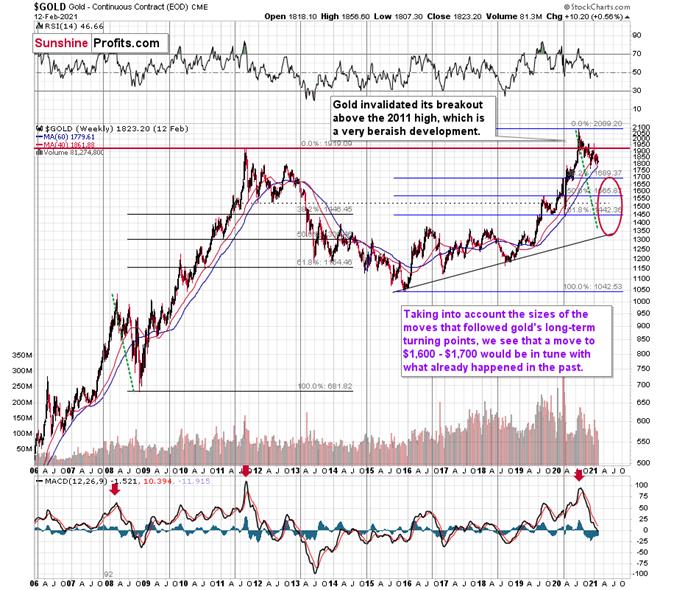
Figure6 - Relative Strength Index (RSI), GOLD, and Moving Average ConvergenceDivergence (MACD) Comparison
If you analyze the red arrow in the lowerpart of the above chart (the weekly MACD sell signal), today’s pattern is similar not only to what we saw in 2011, butalso to what we witnessed in 2008. Thus, if similar events unfold – with the S&P500 falling and the USD Index rising (both seem likely for thefollowing months, even if these moves don’t start right away) – the yellowmetal could plunge to below $1,350 or so. The green dashed line shows whatwould happen gold price, if it was not decline as much as it did in 2008.
However,as of right now, my initial target is $1,700, with $1,500 likely over themedium-term. But as mentioned, if the S&P 500and the USD Index add ripples to the bearish current, $1,400 (or even ~$1,350)could occur amid the perfect storm. ~$1,500 still remains the most likelydownside target for the final bottom, though.
Thank you for reading our free analysistoday. Please note that the above is just a small fraction of today’sall-encompassing Gold & Silver Trading Alert. The latter includes multiplepremium details such as the targets for gold and mining stocks that could bereached in the next few weeks. If you’d like to read those premium details, wehave good news for you. As soon as you sign up for our free gold newsletter,you’ll get a free 7-day no-obligation trial access to our premium Gold &Silver Trading Alerts. It’s really free – sign up today.
Przemyslaw Radomski, CFA
Founder, Editor-in-chief
Toolsfor Effective Gold & Silver Investments - SunshineProfits.com
Tools für EffektivesGold- und Silber-Investment - SunshineProfits.DE
* * * * *
About Sunshine Profits
SunshineProfits enables anyone to forecast market changes with a level of accuracy thatwas once only available to closed-door institutions. It provides free trialaccess to its best investment tools (including lists of best gold stocks and best silver stocks),proprietary gold & silver indicators, buy & sell signals, weekly newsletter, and more. Seeing is believing.
Disclaimer
All essays, research and information found aboverepresent analyses and opinions of Przemyslaw Radomski, CFA and SunshineProfits' associates only. As such, it may prove wrong and be a subject tochange without notice. Opinions and analyses were based on data available toauthors of respective essays at the time of writing. Although the informationprovided above is based on careful research and sources that are believed to beaccurate, Przemyslaw Radomski, CFA and his associates do not guarantee theaccuracy or thoroughness of the data or information reported. The opinionspublished above are neither an offer nor a recommendation to purchase or sell anysecurities. Mr. Radomski is not a Registered Securities Advisor. By readingPrzemyslaw Radomski's, CFA reports you fully agree that he will not be heldresponsible or liable for any decisions you make regarding any informationprovided in these reports. Investing, trading and speculation in any financialmarkets may involve high risk of loss. Przemyslaw Radomski, CFA, SunshineProfits' employees and affiliates as well as members of their families may havea short or long position in any securities, including those mentioned in any ofthe reports or essays, and may make additional purchases and/or sales of thosesecurities without notice.
Przemyslaw Radomski Archive |
© 2005-2019 http://www.MarketOracle.co.uk - The Market Oracle is a FREE Daily Financial Markets Analysis & Forecasting online publication.
