History of Yield Curve Inversions and Gold / Commodities / Gold & Silver 2019

 The inversion of the yield curve is of crucialimportance as it has historically been one of the most reliable recessionarygauges. Consequently, we invite you to read our today’s article about the historyof the yield curve inversions and find out whether the recession is coming, andwhat does it mean for the gold market.
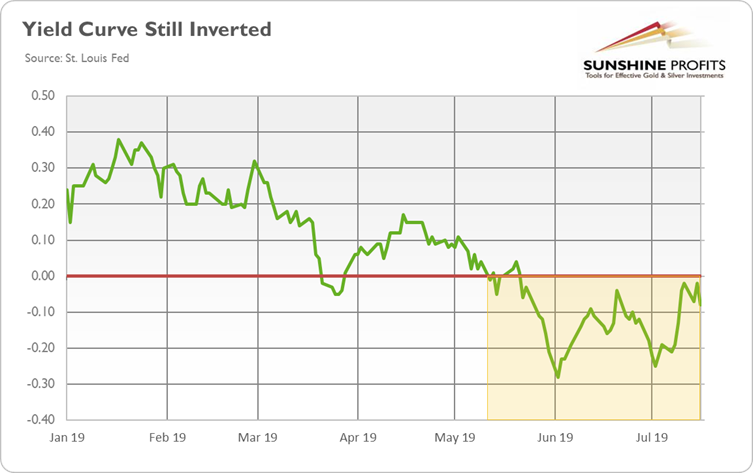
We keep our promises. In the previous edition ofthe Market Overview, we promised our Readers to “dig even deeper into thepredictive power of the yield curve”. As a refresher, please take a look at thechart below. It shows the U.S. Treasury yield curve, or actually not the wholecurve, but the spread between 10-year and 3-month government bonds. As one cansee, that difference is still negative (asof July 19). It means that the yield curveremains inverted (on a daily basis) since May 2019 (we abstract from theshort-lived dip in March 2019).
Chart 1: Yieldcurve (spread between US 10-year and 3-month Treasuries, daily numbers, in %)in 2019.
The inversion of the yield curve is of crucialimportance as it has historically been one of the most reliable recessionarygauges. Indeed, the inverted yield curve is an anomaly happening rarely, and is almost always followed by arecession. The chart below presents the history of the U.S. yieldcurve inversions, as provided by the New York Fed.
Chart 2: Yield curve (spread between US 10-year and3-month Treasuries, monthly averages, data retrieved from the New York Fed, in%) in 2019.
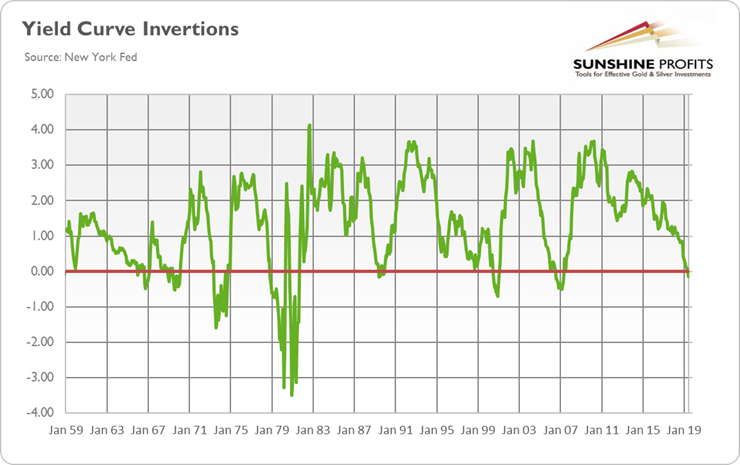
As you can see, the yield curve inverted before both the dot-com bubble and the GreatRecession, the two mostUS recent recessions. The table below provides a more detailed dating of theyield curve inversions and the following recessions.
Table 1: U.S. yield curve inversions and recessions
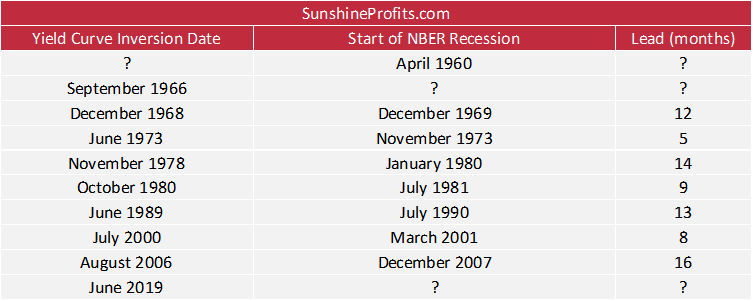
Our data series goes back to 1953 – since then, wehad eight yield curve inversions and almost all of them were followed by arecession. The only exception was September 1966. The yield curve inverted, butno officially-declared recession took place. However, there was a credit crunchin 1966 and the slowdown in economic growth in 1967, so the relationship between the flattening of the yield curve and economicgrowth was still there, although a weaker one.
And there was also one case when the yield curvedid not invert, the recession of 1960-1961. However, the spread narrowed substantially, falling below 1 percent in mid-1959,and reaching 0.09 percent in December 1959. Additionally, although the10-year/3-month spread did not become negative, the 10-year/1-year spread fellbelow zero in September 1959, seven months before the onset of recession.
Hence, although we put question marks in the tableat these two cases, the predictive powerof the inversion of the yield curve remains, at least historically speaking,very powerful. As the average span between inversions and subsequentrecessions has been 11 months, with a range of 5 to 16 months, and the yield curve inverted in June 2019 (in terms of monthly averages), we should expect recession somewhere betweenNovember 2019 and October 2020, possibly around May 2020.
Indeed, thiskey indicator is now flashing red light warning. Please examine the nexttwo charts. They might be the most valuable charts you will see in theforeseeable future, so look carefully.
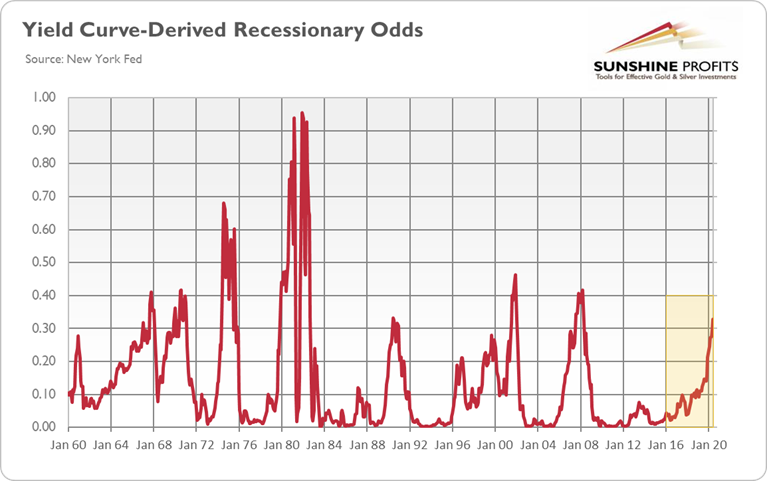
The first one displays the recessionary oddsderived from the yield curve and is calculated by the New York Fed. As one cansee, the probability of a recession inAmerica twelve months ahead is 32.88 percent, an important jump inrecessionary odds from 12.51 percent one year ago and from 29.62 percent in May2019. They are now above 30 percent, an important level, whose surpassing was always followed by a recession.
Chart 3: Yield curve-derived recession probabilities twelve months ahead(calculated by the New York Fed, in %) from January 1960 to June 2020.
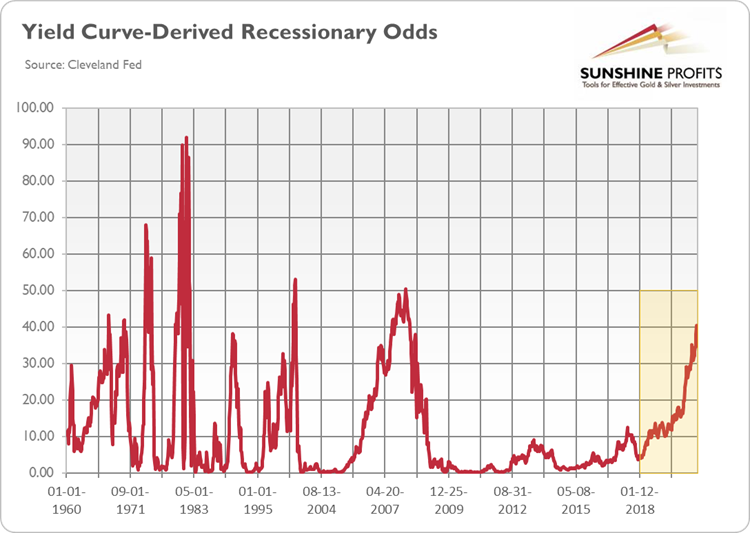
The yield curve-derivedrecession odds calculated by the Cleveland Fed are even more worrisome, as they soaredfrom 14 percent one year ago to more than 40 percent in June 2019, the levelwhich never was crossed without a recession following.
Chart4: Yield curve-derived recession probabilities twelve months ahead(calculated by the Cleveland Fed in %) from January 1960 to June 2020.
Itmeans that theodds of a recession have increased compared to the last month. Two important levels in both models – 30 and 40percent, respectively – were exceeded, so we feel obliged to warn again ourReaders that there are high chances, or even very high chances right now,of the U.S. recession arriving somewhere around the second quarter of 2020.
It might be, of course, the case that this timewill be different. The yield curve is not an ideal recessionary indicator. Butit is probably the best one we have. So, it would be unwise to ignore it. Whenyou read these words, the Fed has probablyjust cut interestrates, “just incase”. They adopted a risk management principles to the monetary policy, concluding that “insurance cut” is warranted. Consequently, perhaps investors should alsoapply a risk management approach to their investment portfolios and buy some insurance,such as gold, “just in case”?
If you enjoyed the above analysis, we invite you tocheck out our other services. We provide detailed fundamental analyses of thegold market in our monthly Gold Market Overview reports andwe provide daily Gold & Silver Trading Alerts with clearbuy and sell signals. If you’re not ready to subscribe yet and are not on ourgold mailing list yet, we urge you to sign up. It’s free and if you don’t likeit, you can easily unsubscribe. Sign uptoday!
Arkadiusz Sieron
Sunshine Profits‘ MarketOverview Editor
Disclaimer
All essays, research and information found aboverepresent analyses and opinions of Przemyslaw Radomski, CFA and SunshineProfits' associates only. As such, it may prove wrong and be a subject tochange without notice. Opinions and analyses were based on data available toauthors of respective essays at the time of writing. Although the informationprovided above is based on careful research and sources that are believed to beaccurate, Przemyslaw Radomski, CFA and his associates do not guarantee theaccuracy or thoroughness of the data or information reported. The opinionspublished above are neither an offer nor a recommendation to purchase or sell anysecurities. Mr. Radomski is not a Registered Securities Advisor. By readingPrzemyslaw Radomski's, CFA reports you fully agree that he will not be heldresponsible or liable for any decisions you make regarding any informationprovided in these reports. Investing, trading and speculation in any financialmarkets may involve high risk of loss. Przemyslaw Radomski, CFA, SunshineProfits' employees and affiliates as well as members of their families may havea short or long position in any securities, including those mentioned in any ofthe reports or essays, and may make additional purchases and/or sales of thosesecurities without notice.
Arkadiusz Sieron Archive |
© 2005-2019 http://www.MarketOracle.co.uk - The Market Oracle is a FREE Daily Financial Markets Analysis & Forecasting online publication.