How the EUR/USD Affects Gold Miners; Which ETF Will Suffer More? / Commodities / Gold and Silver Stocks 2021

It’s all connected. The Eurozone’sunderperformance boosts the USD, thus placing pressure on gold and the ETFs.So, which ETFs will suffer most?
A large part of yesterday’sfree version of the analysis focused on the Eurozone’s economicoutlook and how it affects the precious metals. We’ll eventually get to Europeagain later in today’s analysis, but let’s first examine gold related ETFs,namely the GDX and GDXJ. How low can they go? That will depend on the generalmoves in the stock market.
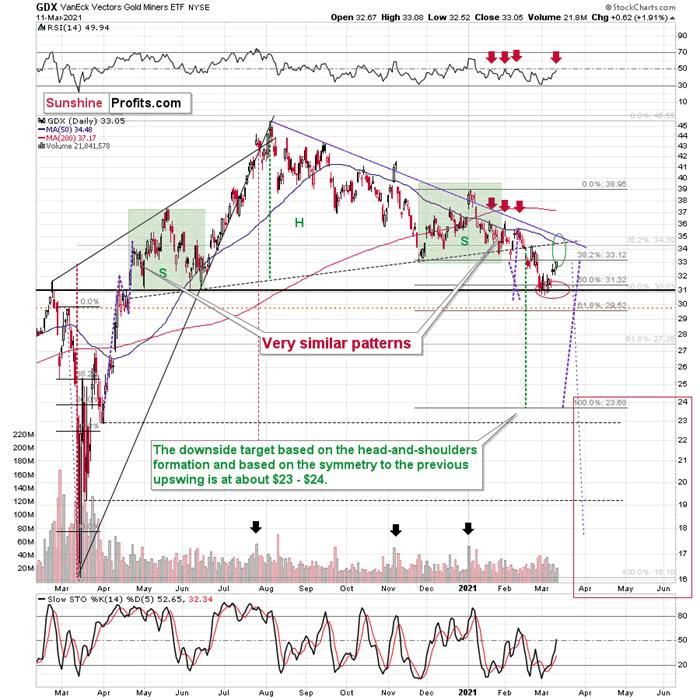
The GDX ETF didn’t move to the strongestcombination of nearby resistance levels, but it did flash a few bearish signs,anyway.
The resistance that it reached wasnotable as it moved to its November 2020 low. Consequently, “it makes sense”for the mining stocks to have topped here.
In yesterday’s(Mar. 11) regular analysis , I wrote the following about the abovechart:
Minersgenerally paused yesterday (Mar. 10), which is quite natural after a sharpdaily rally. They closed the day slightly higher, but the RSI is not yet at 50 andthe volume that accompanied yesterday’s small move up was nothing to call homeabout. It was just a pause, and the preceding short-term move is now likely tocontinue.
Yesterday’s volume was nothing to callhome about, but the RSI moved to 49.94 – close enough to 50 to be viewed as asell signal.
Moreover, please note that whilespike-high volume would be a reversal indication, it’s not required for a topto form. The recent small tops formed without high volume.
Consequently, it could be the case thatthe top in the mining stocks is in, and that by sellingGDX at $32.96 yesterday (March 11) we exited the long positions (and entered short ones) practicallyright at the top – a week after buyingin the $30.80 - $31 area .
Before anyone asks, yes, miners werestrong relative to gold yesterday, but it was practically the only thing thatwas positive about yesterday’s session and the USDX’s performance along withgold’s weakness seem more important.
Please keep in mind that every now andthen miners very briefly (!) fake their strength (or weakness) relative to goldright before the reversal. The 2016 rally started with a fake breakdown andfake underperformance of gold. So, while the continuous underperformance ofminers (compared to gold) is very often bearish, a single day of strength orweakness might be a trap.
How low can the GDX ETF go? Our finaldownside target area ($15 – $24.5) is quite broad, because a lot depends onwhat the general stock market will do. I’ll be looking at gold for the keysigns along with a few other factors (including the GoldMiners Bullish Percent Index ) and determined the buying opportunitybased on them – not necessarily based on the price of the GDX or GDXJ byitself.
Yes, this target is quite low, and thusmight appear unrealistic, but let’s consider the following:
Miners are slightly above theirearly-2020 high – just like gold.Gold is likely to decline toits 2020 lows or soGeneral stock market might havejust topped.Considering all three above factorsit’s clear that a move to even the 2020 lows is not out of the question.
And this means that junior miners mightdecline more than senior miners. A move from the current levels to the 2020would imply a decline by about 50% in case of the GDX, and by about 60% in caseof the GDXJ.
Speaking of the GDXJ, let’s take a lookat its chart.
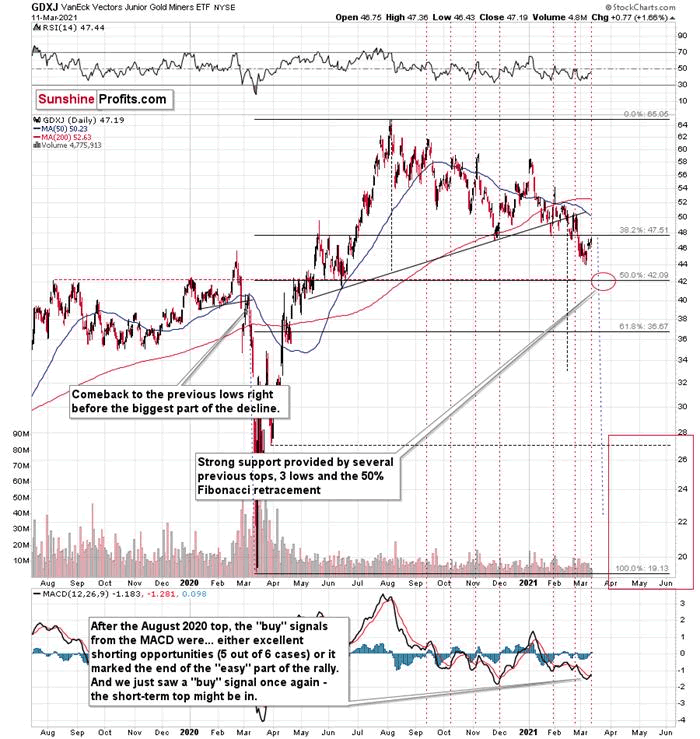
The most interesting thing on the abovechart is a big red warning flag forbeginner investors . The flag reads: “verify the efficiency of a given toolon a given market, before applying it”.
The bottom part of the above chartfeatures the MACDindicator . Normally, when the indicator line (black) crosses itssignal line (red), we have a signal. If it’s moves above the signal line, it’sa buy sign, and if it moves below it, it’s a sell sign.
But.
If one actually looks at what happenedafter the previous “buy signals” in the recent months, they will see that in 5out of 6 cases, these “buy signals” practically marked the exact tops, thusbeing very effective sell signals! In the remaining case, it was a goodindication that the easy part of the corrective upswing was over.
I’m not only describing the above due toits educational value, but because we actually saw a “buy signal” from theMACD, which was quite likely really a sell signal. Today’s pre-market declinein gold (and the move lower in the GDXJ in the London trading) seems to confirmit.
So, how low can the GDXJ go? As it is thecase with the GDX, a lot depends on the general stock market and our finaltarget area is quite broad (between $18 and $26), and the key indications willcome from other markets and the way they behave relative to each other.
There’s an interim (and strong) supportprovided by the $42.5 level, which might trigger a corrective upswing, butsince we have just seen one, it’s far from being certain that we’ll see anothercorrective upswing so soon. This couldbe another opportunity to profit on a long position in the gold miners ,but we can’t say that we’ll definitely go long at that time – at least notbased on the information that we have available right now. Naturally, we’llkeep monitoring the situation and send out regular (and intraday) Alerts withdetails as more information becomes available.
Having said that, let’s take a look atthe market from the more fundamental angle.
Fundamental Frailty (Part 2)
As you’ve likely noticed, I spend alot of time analyzing the EUR/USD – that’s because the currency pair accountsfor nearly 58% of the movement in the USD Index. And due to Europe’s economic underperformance and therelative outprinting by the European Central Bank (ECB) , a sharp reratingof the EUR/USD could be the engine that drives the USD Index back above 94.5
For some time, I’ve warned that the ECB’sbond-buying program was likely to accelerate. OnJan. 22 , I wrote:
TheECB decreased its bond purchases toward the end of December (2020), Then, onceJanuary hit (2021), it was back to business as usual. As a result, the ECB’s attempt to scale back its asset purchases was (and will be)short-lived. And as the economicconditions worsen, the money printer will be working overtime for theforeseeable future.
And with Eurozone fundamentals continuingto deteriorate, I added on Mar. 9:
The ECB’s splurge couldbegin as early as this week. With Eurozone bond yields already on therise and the debt-ridden economy unlikely to tolerate a sustained ascension,the ECB’s weekly PEPP purchases (pandemic emergency purchase program) arelikely to accelerate.
And what happened?
Well, on Mar. 11, the ECB stuck another fundamental dagger into the heart of the euro. Lamenting the rise in European bond yields, ECB President Christine Lagarde told reporters that “market interestrates have increased since the start of the year, which poses a risk ….Sizeable and persistent increases in these market interest rates, when leftunchecked, could translate into a premature tightening of financingconditions.”
And why is she so worried?
Well, if you analyze the chart below, youcan see that Goldman Sachs’ Financial Conditions Index (FCI) has movedmoderately higher. For context, the FCI is derived by calculating theweighted-average impact of the ECB’s overnight lending rate, sovereign bondyields, corporate bond spreads, equity prices and cross-border tradeconditions.
Please see below:
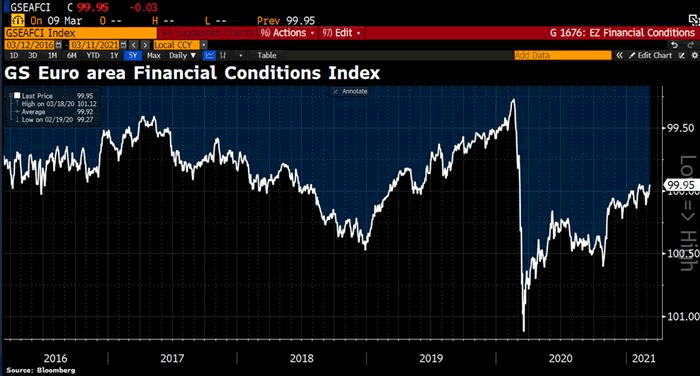
To explain, when the white line above isfalling, it creates an environment where money is cheap, abundant and easy forcorporations to obtain. Conversely, when the white line is rising, it createsthe opposite environment. As you can see, excess liquidity has begun toevaporate.
So, what was the ECB’s response?
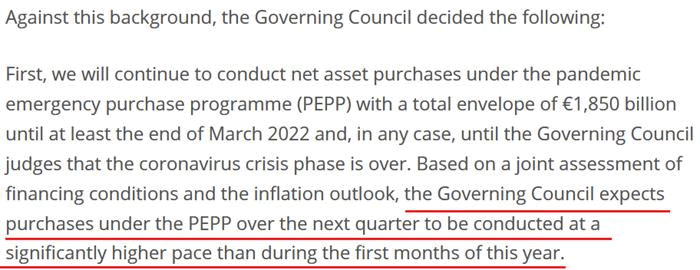
Source:ECB
As expected, the ECB’s weekly PEPPpurchases will now “be conducted at a significantly higher pace.”
Far from news for those that have beenpaying attention, Europe is extremely allergic to higher bond yields. Justyesterday, I wrote that rising Eurozone interest rates remainextremely unlikely. And because a picture is worth a thousand words,notice the reaction from the German 10-Year Government Bond yield?
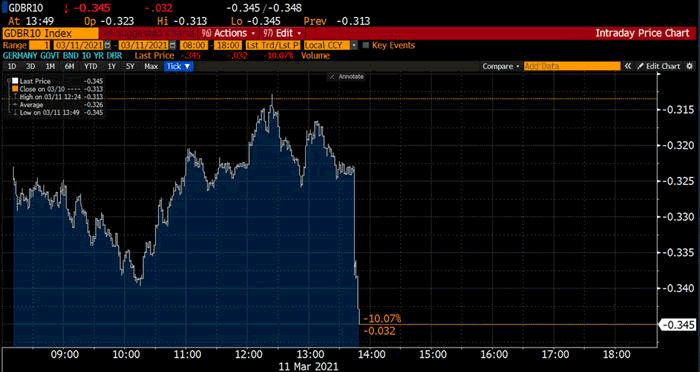
Source:Holger Zschaepitz
Moving in lockstep, the Italian 10-YearGovernment Bond yield also followed suit.
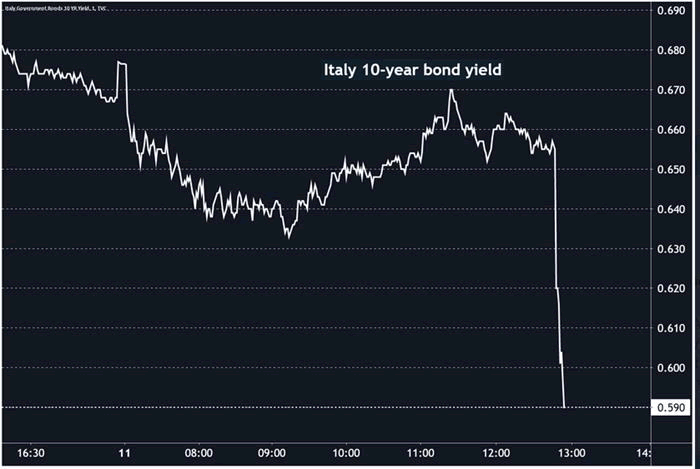
Source:Jeroen Blokland
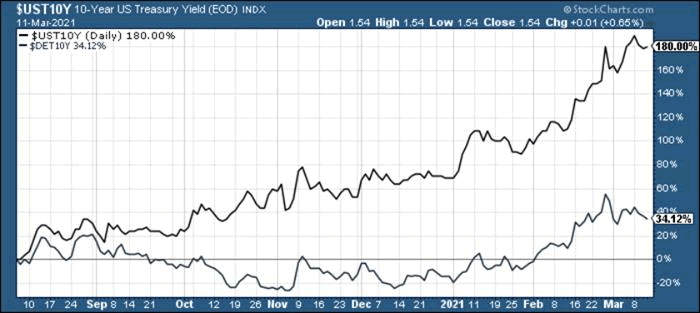
In stark contrast, the U.S. 10-YearTreasury yield actually rallied on Mar. 11 . And demonstrating material outperformance, since bottoming on Aug. 6, the benchmark has raced past the German10-Year Government Bond yield.
Please see below:
What’s more, European lawmakers seem tobelieve that an economic resurgence is forthcoming. Projecting 3.8% GDP growthin 2021 – headlined by 5.5% growth in France (Europe’s second-largest economybehind Germany) – European officials believe that fiscal support will unleashpent-up demand once the coronavirus pandemic subsides.
For context, I wrote on Feb. 11:
Wishing,wanting and hoping, European lawmakers anticipate that more than €300 billion in excess household savings will lead to an economic renaissance in2021. However, when you break it down, the balance only amounts to 4% of annualhousehold income. Thus, the short-term bounce (if any) won’t last very long.
And to that point, if you analyze thechart below, you can see that excesshousehold savings in the Eurozone are now less than $84 billion.
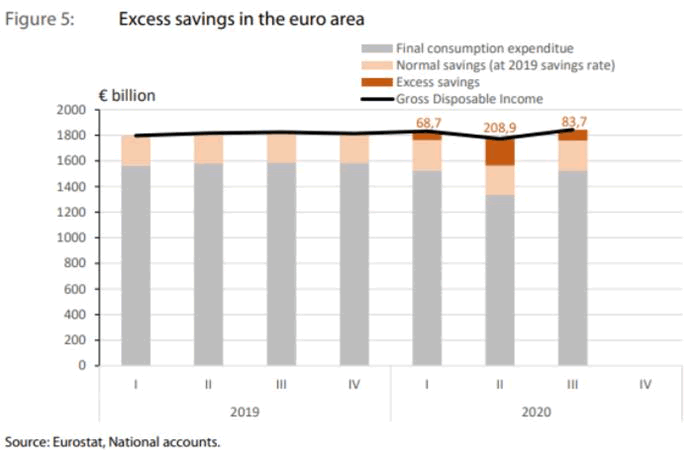
To explain, the brown bars aboverepresent excess household savings in the Eurozone. And from the second-quarterto the third quarter of 2020, Europeanhouseholds have spent nearly 60% of their Q2 excess savings . Thus, at thispace, there won’t be any “excess savings” left.
Also signaling economic weakness, theslump in Eurozone retail sales (released on Mar. 4) shows that consumers arespending their money on necessities and not discretionary items that boost GDP.
Please see below:
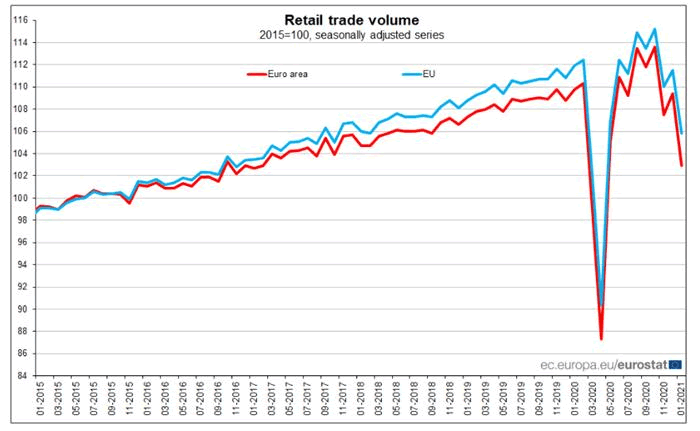
Falling off a cliff, Eurozone retailsales declined by 5.1% in January. Even more revealing, France (– 9.9%) – which is projected to be a beacon of Eurozone growthin 2021 – underperformed the bloc average, with December’s momentum quicklyfading in January.
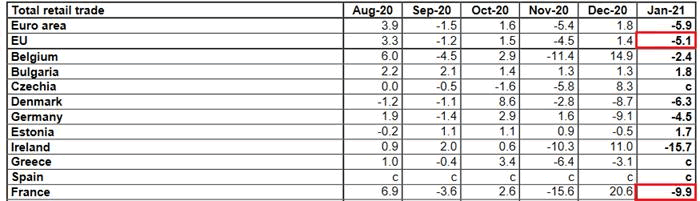
Source:Eurostat
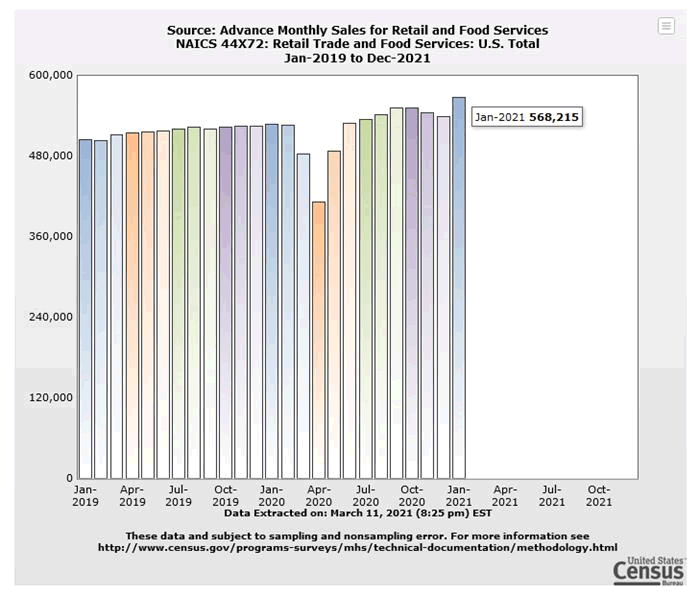
On the flip side, U.S. retail sales rose by 5.3% in January (5.1% excluding food).
Please see below:
And while fundamentals continue to chipaway at the EUR/USD, activity in the futures and options markets are signalinga shift in sentiment. Remember, narratives overpower fundamentals in theshort-term, thus, changing opinions is like trying to fill a glass from adripping faucet. However, the pressure may be rising.
Case in point: the latest Commitments ofTraders (COT) report shows that non-commercialfutures traders (speculators) have increasedthe EUR/USD short positions by more than 6,500 contracts, while reducing theirEUR/USD long positions by nearly 5,900 contracts (the blue box below).
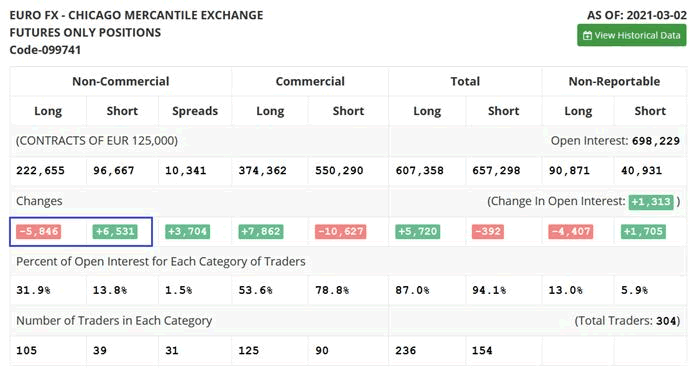
Source:COT
Even more interesting, EUR/USD futures’ volume exploded on Mar.10. If you analyze the right side of the chart below, you can see that anabnormal number of contracts exchanged hands.
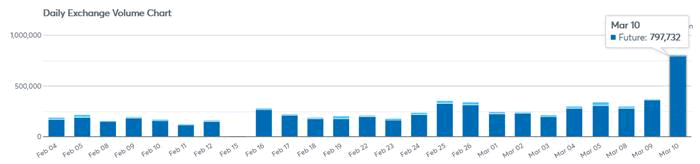
Source:CME Group
And while the volume data doesn’t tell uswhether these are bullish or bearish bets on the EUR/USD, the CME Group’s options data signals that it’sthe latter. If you analyze the graphic below, you can see that there islittle open interest for bullish bets of 1.1950 or above.
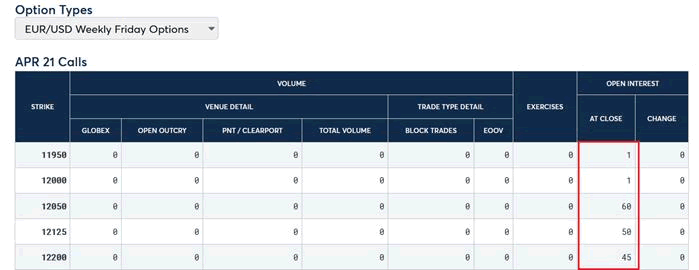
Source:CME Group
In stark contrast, there is plenty of open interest for bearish bets of 1.1850 or below – with 1.1750 the most popular (642contracts still outstanding).
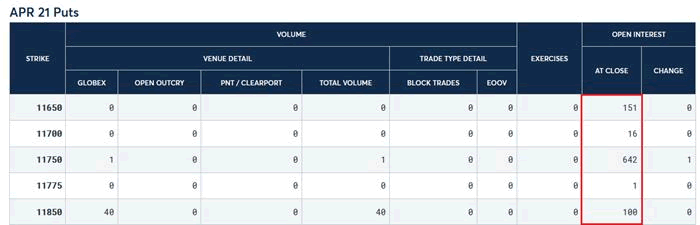
Source:CME Group
In conclusion, the EUR/USD continues toswim against the fundamental current. And while daydreams of a Eurozoneeconomic boom propel European equity bourses to new highs, the misguidedoptimism has also lifted the euro. However, with the USD Index alreadyverifying its medium-term breakout and a boost from the EUR/USD likely to pushit beyond the 94.5 level, the PMs medium-term outlook remains profoundlybearish. And while their correlations with the S&P 500 remains supportivein the short-term (which I predicted would be the case this week), a severecorrection of U.S. equities increases the likelihood of a significant slideover the next few months.
Thank you for reading our free analysistoday. Please note that the above is just a small fraction of today’sall-encompassing Gold & Silver Trading Alert. The latter includes multiplepremium details such as the targets for gold and mining stocks that could be reached in the next few weeks. If you’dlike to read those premium details, we have good news for you. As soon as yousign up for our free gold newsletter, you’ll get a free 7-day no-obligationtrial access to our premium Gold & Silver Trading Alerts. It’s really free– sign up today.
Thank you.
Przemyslaw Radomski, CFA
Founder, Editor-in-chief
Toolsfor Effective Gold & Silver Investments - SunshineProfits.com
Tools für EffektivesGold- und Silber-Investment - SunshineProfits.DE
* * * * *
About Sunshine Profits
SunshineProfits enables anyone to forecast market changes with a level of accuracy thatwas once only available to closed-door institutions. It provides free trialaccess to its best investment tools (including lists of best gold stocks and best silver stocks),proprietary gold & silver indicators, buy & sell signals, weekly newsletter, and more. Seeing is believing.
Disclaimer
All essays, research and information found aboverepresent analyses and opinions of Przemyslaw Radomski, CFA and SunshineProfits' associates only. As such, it may prove wrong and be a subject tochange without notice. Opinions and analyses were based on data available toauthors of respective essays at the time of writing. Although the informationprovided above is based on careful research and sources that are believed to beaccurate, Przemyslaw Radomski, CFA and his associates do not guarantee theaccuracy or thoroughness of the data or information reported. The opinionspublished above are neither an offer nor a recommendation to purchase or sell anysecurities. Mr. Radomski is not a Registered Securities Advisor. By readingPrzemyslaw Radomski's, CFA reports you fully agree that he will not be heldresponsible or liable for any decisions you make regarding any informationprovided in these reports. Investing, trading and speculation in any financialmarkets may involve high risk of loss. Przemyslaw Radomski, CFA, SunshineProfits' employees and affiliates as well as members of their families may havea short or long position in any securities, including those mentioned in any ofthe reports or essays, and may make additional purchases and/or sales of thosesecurities without notice.
Przemyslaw Radomski Archive |
© 2005-2019 http://www.MarketOracle.co.uk - The Market Oracle is a FREE Daily Financial Markets Analysis & Forecasting online publication.