How to Join the Gold Mining Party... Before it Ends / Commodities / Gold and Silver 2021

Forget gold and silver for a moment.Do you hear the music? Yes, it’s coming from the mining ETFs club. But how longwill the party last?
And more importantly, why miners, you mayask? Because miners tend to outperform in the early days of a major rally.
Afterclosing only $0.10 below myinitial downside target of $31 on Mar. 1 , the GDX ETF could be ripe for an upward revision. Able to ignore much of lastweek’s chaos, the GDX ETF’s outperformance of gold and silver signals that thetide has likely turned.
Please see below:
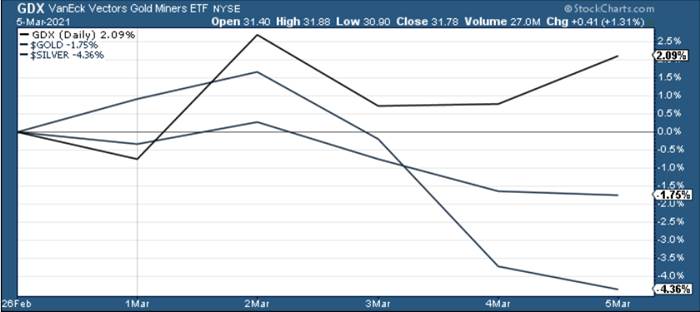
Figure1
To that point, Iwarned on Mar. 1 that help was on the way:
TheGDX ETF has garnered historical support at roughly $29.52. The level alsocoincides with the early-March high, the mid-April low and the 61.8% Fibonacciretracement level. As a result, a corrective upswingto ~$33/$34 could be the miners’ next move.
Furthermore, after alertingsubscribers on Mar. 4 – writing that when gold moves to $1,692, we’ll automatically open long positions inthe miners – the GDX ETF endedFriday’s (Mar. 5) session up by 3.2% from my initial entry of ~$30.80 - $31. Thus, from here, the GDX ETF has roughly 3.8% to 7.0% upside (as of Friday’sclose) before the $33/$34 levels signals that the momentum has run its course.
For now, though, positioning for more upside offers a solid risk-reward proposition . Prior to the initial decline, miners were weakrelative to gold . However, after outperforming on Mar. 5, theirsteady hand was a sign of short-term strength. If you analyze the chart below,you can see that the size and shape of the current price action actuallymirrors what we witnessed back in April.
Please see below:
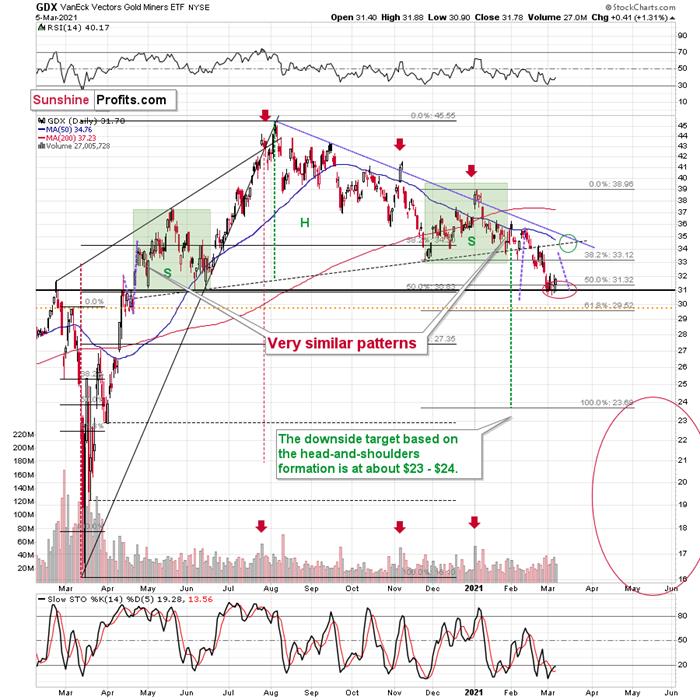
Figure2 - VanEck Vectors Gold Miners ETF (GDX), GDX and Slow Stochastic OscillatorChart Comparison – 2020
For context, I wrote on Mar. 5:
Minersstopped their decline practically right in my target area, which I based on the50% Fibonacci retracement and the 2020 highs and lows. Moreover, the proximityof the $31 level corresponds to the 2019 high and the 2016 high. Since so manysupport levels coincide at the same price (approximately), the latter is likelyto be a very strong support. Moreover, the RSI was just close to 30, which corresponded to short-term buying opportunitiesquite a few times in the past.
In addition, a short-term upswing could provide a potential pathway to $35 –as this level also corresponds with the GDX ETF’s late-February high, itsmonthly declining resistance line and its 50-day moving average. Theabundance of resistance levels – combined with the fact that an upswing wouldfurther verify the GDX ETF’s breakdown below the neckline of its potential headand shoulders pattern – should keep the upward momentum in check.
Over the medium-term, the potential headand shoulders pattern – marked by the shaded green boxes above – also deservesplenty of attention.
For context, I wrote previously:
Eversince the mid-September breakdown below the 50-day movingaverage , the GDX ETF was unable to trigger a substantial and lasting move above this MA. Thetimes when the GDX was able to move above it were also the times when thebiggest short-term declines started.
(…)
Themost recent move higher only made the similarity of this shoulder portion ofthe bearish head-and-shoulderspattern to the left shoulder (figure 2 - both marked with green) bigger. This means that when the GDX breaks below the neck level of the pattern in a decisiveway, the implications are likely to be extremely bearish for the next severalweeks or months.
Dueto the uncanny similarity between the two green rectangles, I decided to checkwhat happens if this mirror-similarity continues. I used purple, dashed linesfor that. There were two important short-term price swings in April 2020 – oneshows the size of the correction and one is a near-vertical move higher.
Copyingthese price moves (purple lines) to the current situation, we get a scenario inwhich GDX (mining stocks) moves to about $31 and then comes back up to about$34. This would be in perfect tune with what I wrote previously. After breakingbelow the head-and-shoulders pattern, gold miners would then be likely toverify this breakdown by moving back up to the neck level of the pattern. Then,we would likely see another powerful slide – perhaps to at least $24.
Thisis especially the case, since silver and mining stocks tend to declineparticularly strongly if the stock market is declining as well. And while theexact timing of the market’s slide is not 100% clear, stocks’ dayof reckoning is coming . And itmight be very, very close.
AsI explained previously, based on the similarities to the 1929 and 2008declines, it could be the case that the preciousmetals sector declines for about 3 months after the general stock market tops. And it seems that we won’t have to waitlong for the latter. In fact, the next big move lower in stocks mightalready be underway, as the mid-Feb. 2021 top could have been the finalmedium-term top.
In conclusion, the gold miners shouldcontinue to glisten as oversold conditions buoy them back to the $33-$35 range.Due to the GDX ETF’s recent strength, combined with gold rallying off of thelows on Mar. 5, the PMs could enjoy a profitable one-week (or so) party. However,with the celebration likely to be short-lived, it’s important to keep things inperspective. While this week’s performance may elicit superficial confidence,medium-term clouds have already formed. As a result, positioning for an extended rally offers more risk thanreward.
(We normally include the "Letters tothe Editor" section in the full version of Gold & Silver TradingAlerts only, but today I decided to include it also in this free version of thefull (about 10x bigger than what you just read) analysis, so that you get theidea of how this part of the analysis looks like. It might be quite informativetoo. Enjoy:)
Letters to the Editor
Q:Could you update your thoughts regarding physical [gold and silver] for thoselooking to acquire additional positions - specifically, what do you thinkpremiums and availability are going to look like when/if spot goes a $100 or$200 down from here? By way of example, I bought some U.S. gold buffaloes at$1854 spot at $1954. Those same coins at $1710 spot are still around $1930, ifthere are any to be found.
A: It’s a tough call, because the premiumvalues don’t follow the technical patterns. Still, based on the analogy tosituations that seem similar to what we saw recently, it seems that we canindeed say something about the likely physical values close to the likely$1,450 bottom.
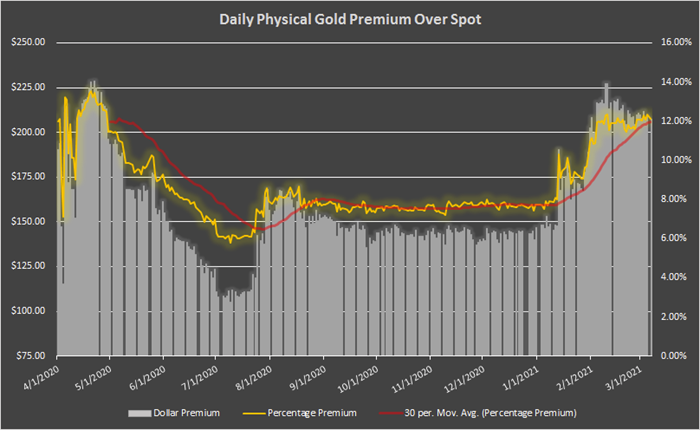
Figure43 - Source: didthesystemcollapse.org
The above chart shows the eBay premiumfor 1 oz Gold American Eagle coins over the spot gold price.
In April 2020, the premium spiked atabout 14%. It was likely even higher in March (we don’t have the direct data),but the volatility back then was bigger than it is right now, so it seems thatthe current premium and the April 2020 premium values are a better proxy forthe future bottoming premiums than the March 2020 bottom premium would be. Ifthe volatility increases, one could see the premium at about 15% or so.
With gold at about $1,450, theabove-mentioned information means Gold American Eagle coins can cost about$1,670.
Still, since gold futures prices seemmore predictable than the prices of bullion coins, I’d focus on the former evenwhile timing the purchase of the latter.
Moreover, please note that I’m planningto focus on buying mining stocks close to the bottom and move to metals onlylater. The reason is that miners tend to outperform in the early days of amajor rally (just like they did in the first quarter of 2016). The fact thatthe premium is likely to be high when gold bottoms in a volatile manner is yetanother reason for the above. When switching from mining stocks to physicalholdings several weeks or months later, one might be buying at a smallerpremium over the spot, and also after having gained more on miners than on themetals. Of course, the above is just my opinion, and you can purchase whateveryou want – after all, it’s your capital and your investment decisions.
Q:Please note that I am glad to see gold moving downwards but I am a littleconfused – the trading report I just received recommends selling at 1690ish butthe mailing previously said 1450ish - please see attached.
Couldyou please investigate and advise.
A: If anything in the Gold & SilverTrading Alerts seems confusing, please refer to the “Summary”, thetrading/investment positions, and the “Overview of the Upcoming Part of theDecline” sections for clarification. In this case, we exited the remainingshort positions when gold hit $1,693 and almost immediately entered long ones(when gold hit $1,692). We now have long positions in the mining stocks withthe plan to exit them in a week or so, and re-enter short positions then,because the next big move is likely to be to the downside(perhaps as low as $1,450 or so). Also, the above is just my opinion, not arecommendation or investment advice.
Q:Hi P.R., thanks for the advice on this trend, it’s been an amazing trade.
AsI’m trading on XAUUSD, are you also able to advise the targets for a gold longentry,
orshould I wait for the final bottom before opening any longs?
A: I’m very happy that you’re makingprofits thanks to my analyses. While I think that the very short-term (for thenext 5 trading days or so) outlook for gold, silver and mining stocks isbullish, I think the targets are more predictable for mining stocks than theyare for gold and – especially – silver. Still, this time, the short-term upsidetarget for gold is also relatively clear – at about $1,770. That’s why I putthe $1,758 in the “For-your-information target” for gold in the “Summary”section below.
Q:Are we looking for the short-term upside move to be 1-5 weeks before the finaldecline into the 1350-1500 zone? I'm a little unsure of the timing you'relaying out.
A: I’m looking for the short-term upswingto take place between 1 and 3 weeks – that’s the part of the “Overview of theUpcoming Part of the Decline” section about it:
It seems to me that the initial bottom has either just formed or is aboutto form with gold falling to roughly $1,670 - $1,680, likely this week.I expect the rebound to take place during the next 1-3 weeks.After the rebound (perhaps to $33 - $34 in the GDX), I plan to getback in with the short position in the mining stocks.In my opinion it’s most likely thatthis counter-trend rally will take about 1 – 1.5 weeks. Then, I think that thedecline to about $1,450 in gold will start.
Q:Thank you for sending out the Alert # 2 with the new changes in the Gold andSilver trades today. This is necessary, so please send out the alert once youenter back to the short positions, please.
A: I’m happy that you enjoyed thisintraday Alert. I will indeed send you – my subscribers – an intradayconfirmation that the long positions were closed and when we enter new shortpositions. Still, please note that we already have binding profit-take exitprices in place, which means that when prices move to the target levels (e.g.,GDX to $33.92), the long positions should be automatically closed, and profitsshould be taken off the table – even without an additional confirmation from me(it takes time for me to write and send the message and then some time usuallypasses before one is able to act on my message).
Q:You have informed us to make the move when the Gold price “REACHES” $1693.00.My question is; Does the word “Reach” mean when the price touches that point,if only for a moment, or does “Reach” mean when it closes the day at or below$1693.00?
Thankyou for your response to this question.
A: “Reaching” a price means the samething as “touching” the price or “moving to” the price. This means moving tothis price level on an intraday basis –even for just one tick . If I mean closing prices, I will specificallydescribe them as such.
For instance, I currently have bindingexit positions for the current long position in the mining stocks – and theseare exactly the price levels that I have put in my brokerage account as a limitsell order.
Q:Please comment on the Hindenburg Omen for stocks:
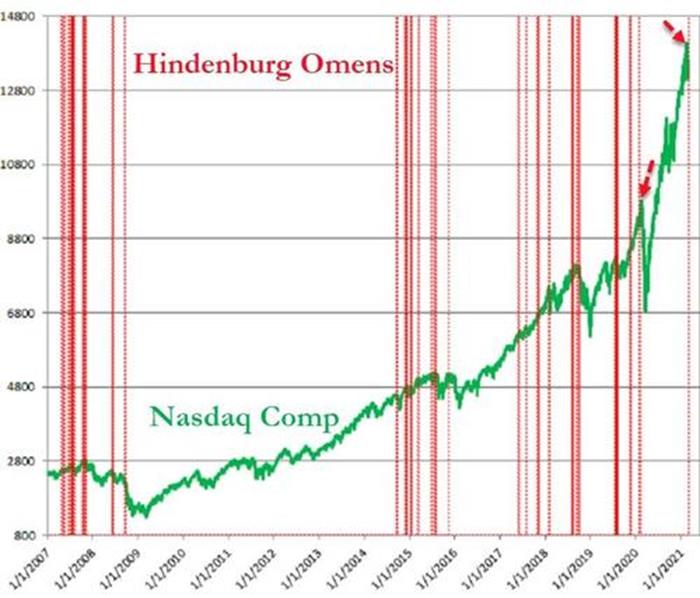
Figure44 - Source: Refinitiv
A: Thanks. The Hindenburg omen is not oneof the most reliable indicators - even on the above chart, it’s clear that mostof the signals were not followed by declines. Please note how many fake initialsignals there were before stocks finally declined in 2019 or 2020. There aremany other reasons to think that stocks are going to move much lower, though.In the very short-term they could still move higher, but this move could befake and could turn out to be the right shoulder of the head-and-shoulders topformation.
Q: 1) for shorter-term trades such as thepotential 10% pop in the GDX, is NUGT better?
2) the plan after we re-enter a shorttrade when the GDX gets to $33/$34 might mean a longer haul before we hit rock bottom . You have mentionedtime-scales up to 20 weeks (ish). Due to a longer holding period , would the CFD route be a cheaper route whencompared to NUGT? I’m asking in general terms because each provider imposesdifferent fees and I don’t expect you to comment on the fees charged by IG,which is the service I use.
I also recognize that NUGT only offers 2X leverage, whereas CFD’s offer up to five times leverage.
Finally, the manner in which you detailthe rich tapestry of the economic forces that impact PMs is revealing andeducational. I find this all fascinating.
I have my own views which can be summedup like this: How many inflationary false-dawns and panics has the bond markethad? Ever since 2008, when the FED launched QE, there have been numerous boutsand hissy fits of inflationary expectations that have subsequently sunk like adodgy soufflé. I think this time is no different and it’s entirely possible the30-year bond could drop to ZERO. I am in the deflationary camp.
How might the 10 year at zero or possiblysub-zero and longer, out on the duration curve to (TLT ETF) dropping to 0.5%,affect the price of gold?
Your thoughts as ever, are muchappreciated
A: 1) That depends on whether one seeksleverage or not, and how much thereof. Please note that some short-term tradescould sometimes become medium-term trades if the market decides to consolidateor move in the other direction before continuing the predicted trend. In thiscase, non-leveraged instruments are at an advantage over the leveraged ones,because they don’t suffer from the back-and-forth trading as much as theleveraged ones do.
If one’s desired exposure to the GDX ETF wouldn’texceed the cash that one dedicated to trading, then in order to have the sameexposure one would simply have half of the capital employed in NUGT (which is2x leveraged). This way, the exposure would be identical, but the NUGT wouldimply additional risk of losing more capital if the trade takes much longerthan planned and/or if the price moves adversely first.
Please note that there is also anadditional way to gain leverage (it’s not available for everyone, though) andthat is through the use of margin on one’s brokerage account. I’d prefer to usemargin for the GDX before aiming to gain leverage through NUGT.
In other words, I’d first use more cashfor GDX before I’d go into NUGT. If I wanted to have even bigger exposure thanthe one achieved by employing more capital to GDX, I would then consider usingmargin, and then I would consider using NUGT if I still wanted to get moreleverage.
There might be some traders who wouldseek to combine both for even bigger leverage (buying NUGT on margin), but thisis definitely not something that I’d recommend to most people. In fact, itseems that in many cases, sticking to the GDX would be a good way to go.
2) I think I already replied to the firstpart of your question (NUGT vs. CFD) above. Also, for other people reading thisreply – please note that CFDs (contracts for difference) are not available inmany areas, including the USA and Canada.
I’m glad to read that you enjoy readingmy explanations of the current situation in the markets (precisely, my opinionson it).
Real interest rates are one of the mostimportant drivers for gold (along with the USD Index), so a drop in the 10-yearrates to zero or sub-zero levels would likely be very beneficial for the goldprices.
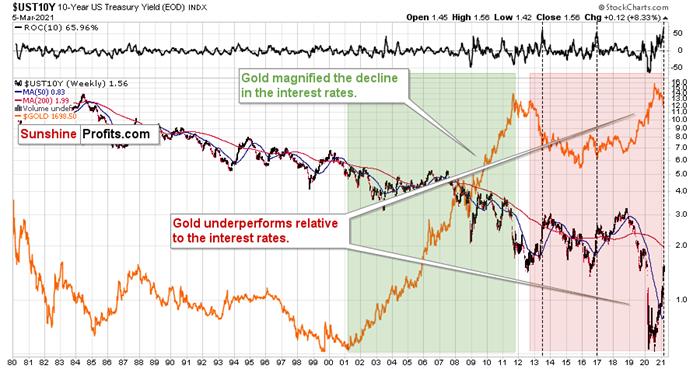
Figure45
Also, based on the pace at which therates have rallied recently, they might be topping here, but… There was nodecline in the previous 40 years that was as big as what we saw between 2018and 2020. Consequently, the corrective upswing might be bigger as well. Also,the above chart is not necessarily the scale that is big enough to make verylong-term conclusions.
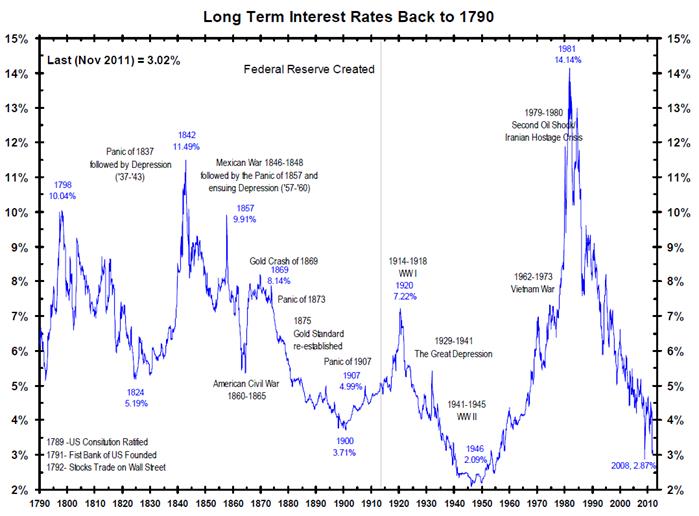
Figure46
Over the past centuries, whenever therates fell very low, they then rallied back up with vengeance. After WW2, ittheoretically would have been a “good idea” to keep stimulating the economywith low rates – and yet, they soared. Right now, the monetary authoritiesstrive to be very dovish and keep pumping liquidity into the system, and yetthe rates are rallying anyway.
So, while the analogy to the previousyears – or the past few decades – suggests that the rally in the rates might beover or close to being over, the very long-term chart suggests otherwise.
To make the situation even morecomplicated, if the stock market has already topped in February, and we havealready entered the Kondratiev winter cycle, it means that we can theoreticallyexpect the rates to fall, then rise in a credit crunch, and then fall muchlower.
All in all, the outlook for the interestrates is anything but simple and clear. Perhaps what we see right now alreadyIS the credit crunch and the 10-year rates are on their way to above 2% - afterall, they used to return above their 200-day moving average after the previousmedium-term declines. It seems to me that the move above 2% in the 10-yearrates could correspond with gold’s decline below $1,500.
Thank you for reading our free analysistoday. Please note that the above is just a small fraction of today’sall-encompassing Gold & Silver Trading Alert. The latter includes multiplepremium details such as the targets for gold and mining stocks that could be reached in the next few weeks. If you’dlike to read those premium details, we have good news for you. As soon as yousign up for our free gold newsletter, you’ll get a free 7-day no-obligationtrial access to our premium Gold & Silver Trading Alerts. It’s really free– sign up today.
Thank you.
Przemyslaw Radomski, CFA
Founder, Editor-in-chief
Toolsfor Effective Gold & Silver Investments - SunshineProfits.com
Tools für EffektivesGold- und Silber-Investment - SunshineProfits.DE
* * * * *
About Sunshine Profits
SunshineProfits enables anyone to forecast market changes with a level of accuracy thatwas once only available to closed-door institutions. It provides free trialaccess to its best investment tools (including lists of best gold stocks and best silver stocks),proprietary gold & silver indicators, buy & sell signals, weekly newsletter, and more. Seeing is believing.
Disclaimer
All essays, research and information found aboverepresent analyses and opinions of Przemyslaw Radomski, CFA and SunshineProfits' associates only. As such, it may prove wrong and be a subject tochange without notice. Opinions and analyses were based on data available toauthors of respective essays at the time of writing. Although the informationprovided above is based on careful research and sources that are believed to beaccurate, Przemyslaw Radomski, CFA and his associates do not guarantee theaccuracy or thoroughness of the data or information reported. The opinionspublished above are neither an offer nor a recommendation to purchase or sell anysecurities. Mr. Radomski is not a Registered Securities Advisor. By readingPrzemyslaw Radomski's, CFA reports you fully agree that he will not be heldresponsible or liable for any decisions you make regarding any informationprovided in these reports. Investing, trading and speculation in any financialmarkets may involve high risk of loss. Przemyslaw Radomski, CFA, SunshineProfits' employees and affiliates as well as members of their families may havea short or long position in any securities, including those mentioned in any ofthe reports or essays, and may make additional purchases and/or sales of thosesecurities without notice.
Przemyslaw Radomski Archive |
© 2005-2019 http://www.MarketOracle.co.uk - The Market Oracle is a FREE Daily Financial Markets Analysis & Forecasting online publication.