HUI Update...A Treat for Long Suffering Gold Traders
By Rambus / February 20, 2019 / news.goldseek.com / Article Link
By: Rambus
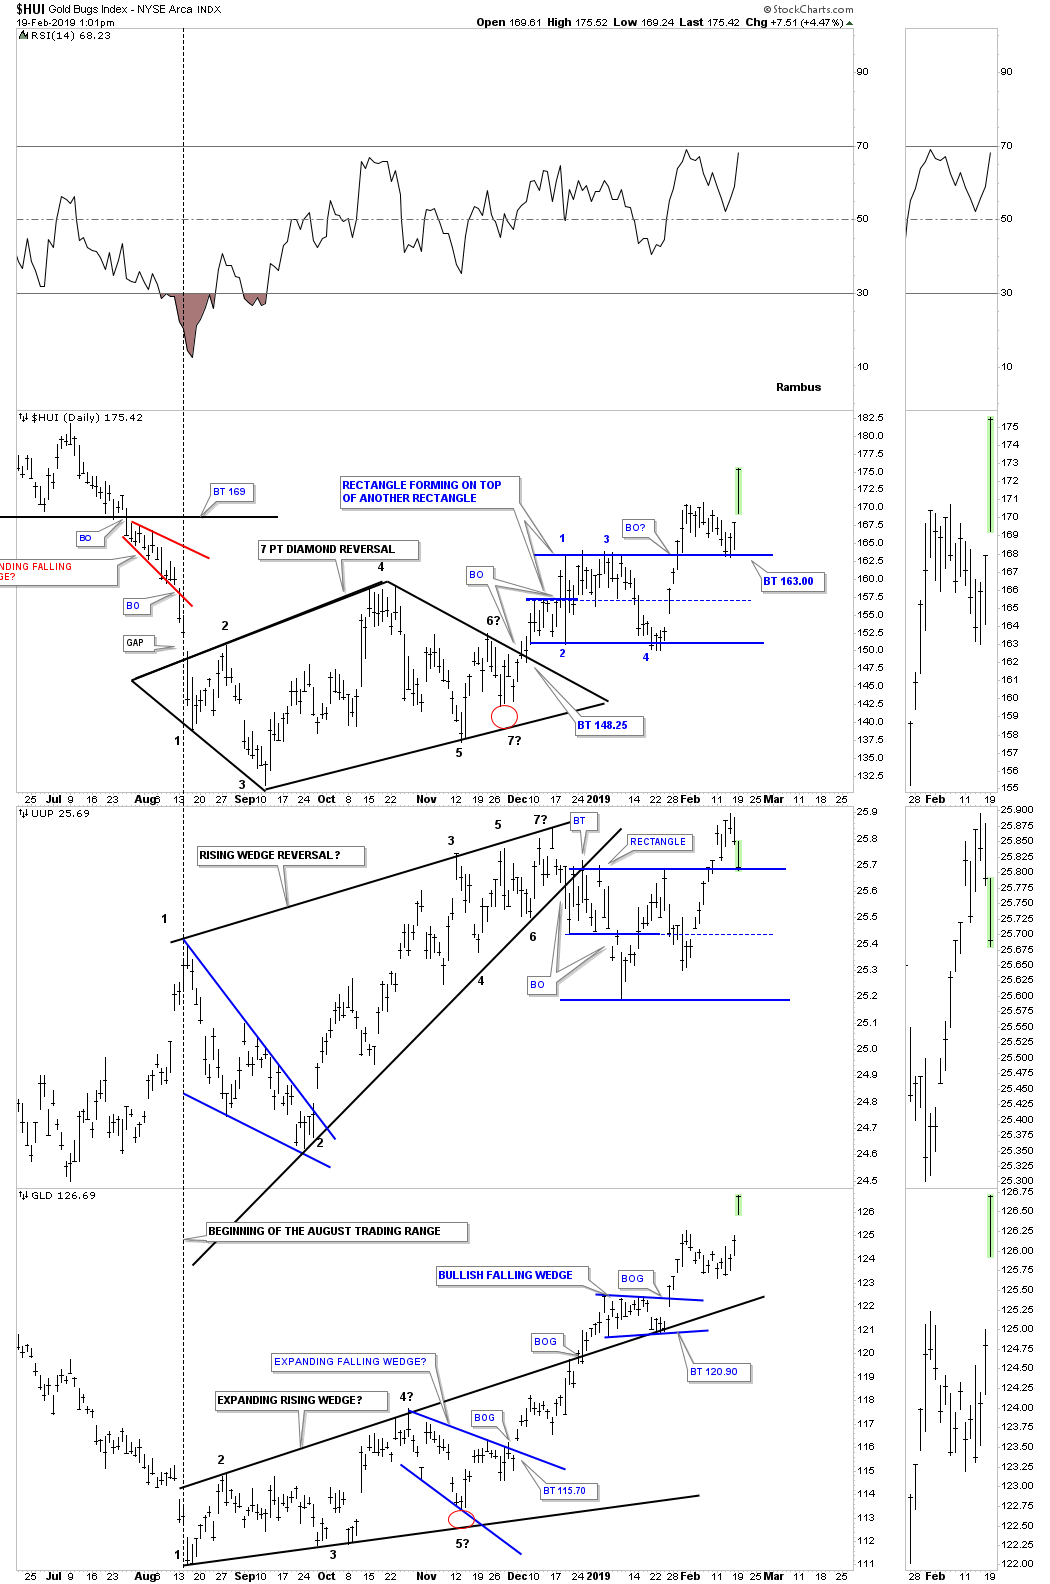
Below is the combo chart which has the HUI on top, the UUP in the middle and GLD on the bottom. Everything looks fine.
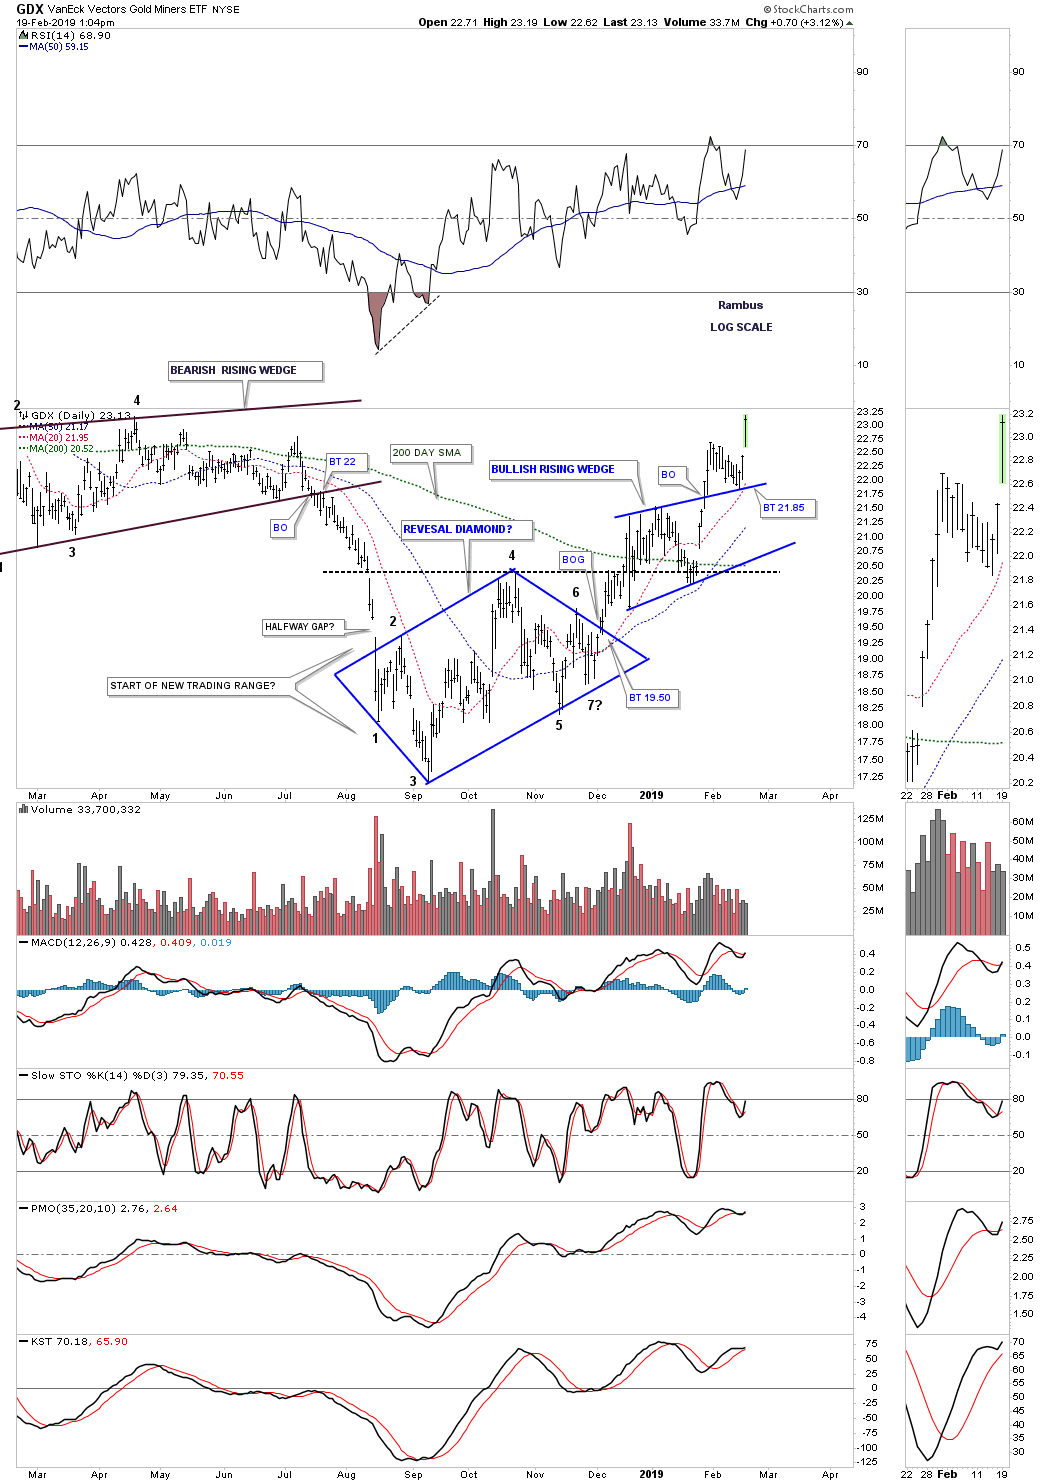
The GDX daily chart shows a nice breakout and backtest to the top rail of the bullish rising wedge and now the door is open for a move higher.
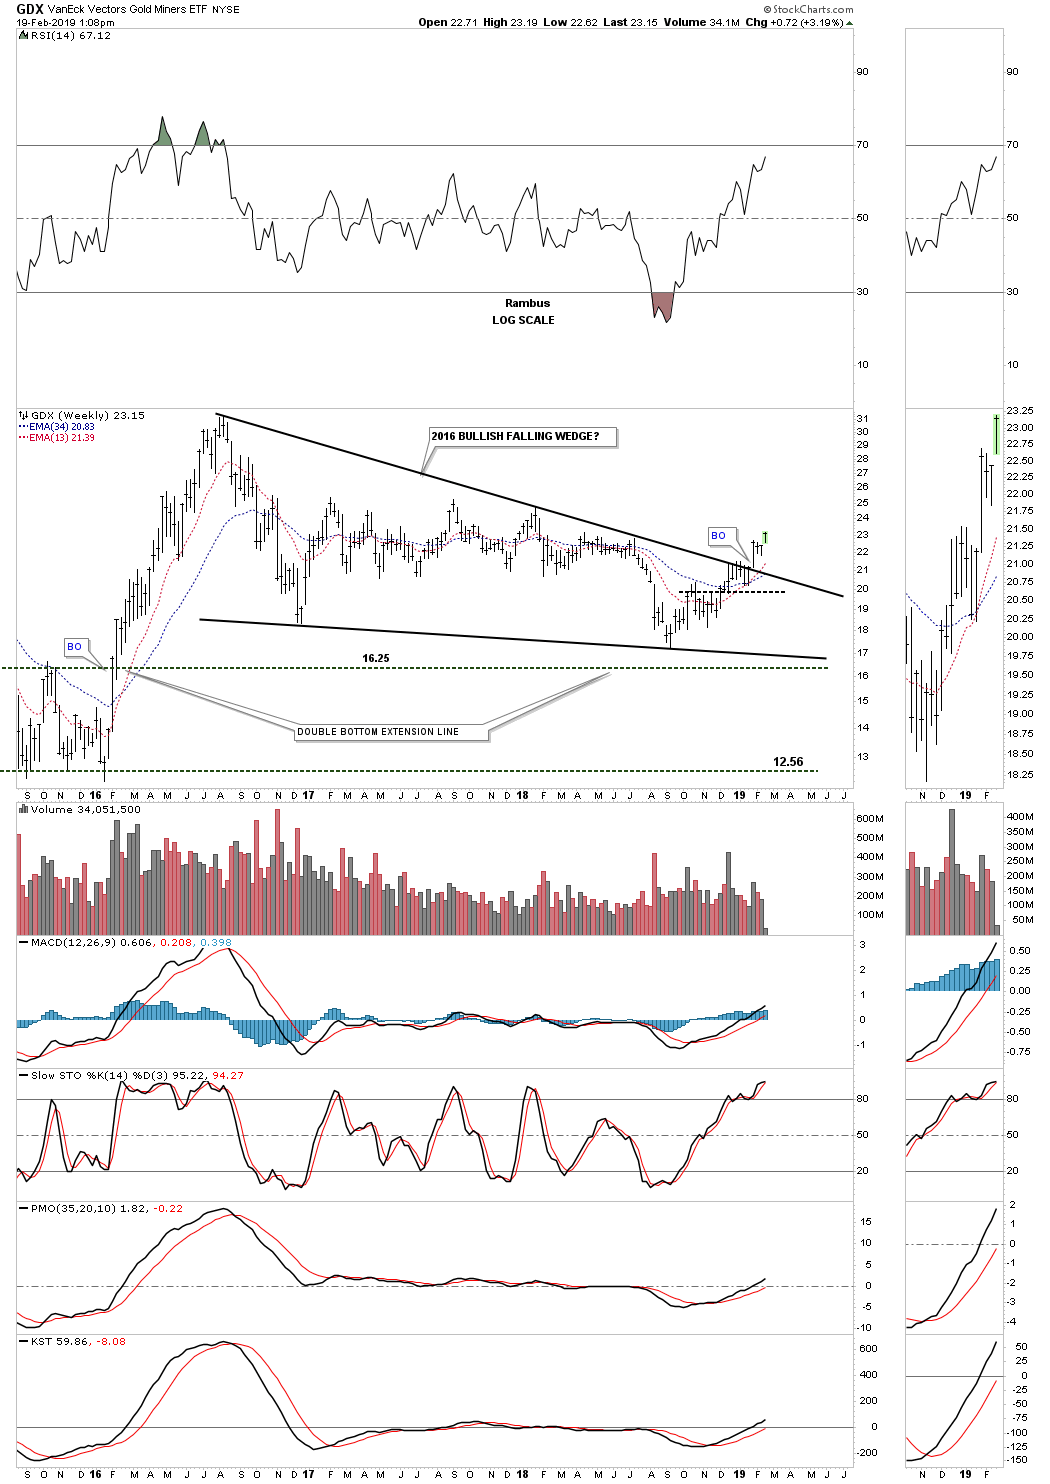
Below is the weekly chart for the GDX which shows the breakout starting to gaining some momentum.
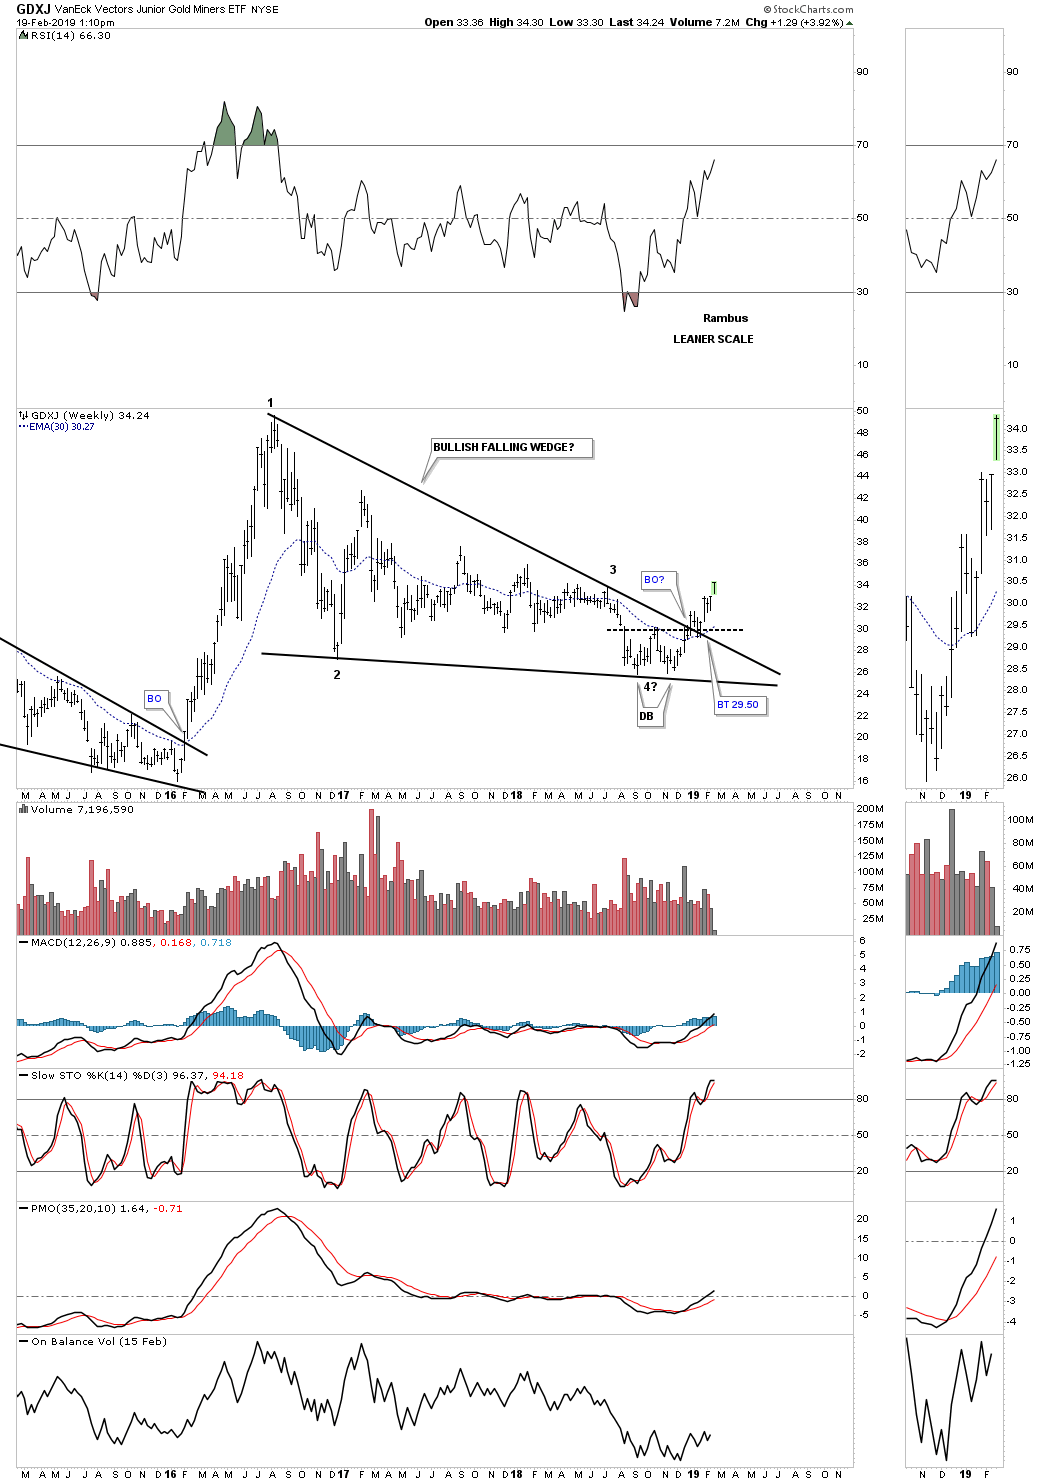
Below is the weekly chart for the GDXJ which shows all systems go.
I will be out of the office this afternoon and probably won't make it back before the close. It's been a long time coming so enjoy this day as there will be many more to come. It's just getting started.
- Rambus, www.rambus1.com
Recent News
Immediate trigger for crash was new Fed Chairman pick
February 02, 2026 / www.canadianminingreport.com
Gold stocks slump on metal price decline
February 02, 2026 / www.canadianminingreport.com
Is the gold market starting to turn 'irrationally exuberant'?
January 26, 2026 / www.canadianminingreport.com
Gold stocks explode up as equity markets languish
January 26, 2026 / www.canadianminingreport.com
Gold stocks outpace flat large caps
January 19, 2026 / www.canadianminingreport.com