INK Canadian Insider Index bobbles, but Bollinger flush suggests bounce
Thank you for joining us in a weekly technical look at the mid-cap oriented INK Canadian Insider (CIN) Index. Last week, the INK CIN fell further while following the precipitous path of copper and other commodities, plunging as low as 1239.97 before rebounding into the end of the week at 1262.38 for a loss of 6.9 points.
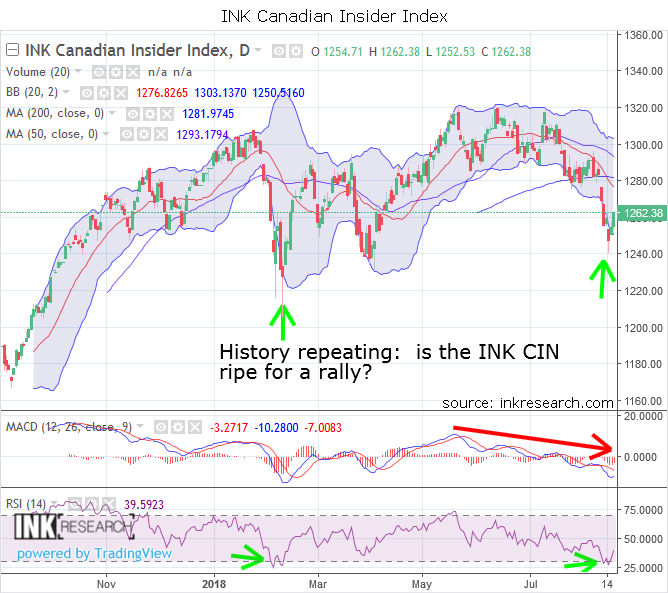
A bright spot for the Index was that the short-term momentum indicator RSI managed to rise to 39.59 for a gain of 5.17 or 15%. In addition, RSI made a 'W' bottom pattern similar to what we saw at its February bottom. However, the long-term momentum indicator, MACD, continued its snowballing descent, slashing 2.62 points to finish at -3.27. For the time being, MACD appears locked in a very steep downtrend.
Support is now at 1250 (lower Bollinger band) and 1263. Resistance is at 1269 and 1280 (200-day moving average).
Last week, we suggested that the Index might fall and fully pierce the lower Bollinger band. In fact, since the Index did pull back as much as 10 points below this key area, we can expect a rebound to begin shortly. What's also interesting is that the Index's February bottom also began with a reversal after both a Bollinger band plunge and a 'W' pattern in its RSI. On the greenback front, the ever-resilient US dollar closed the week with an unhappy looking red candle that looks similar to blow-off tops in its recent past. In addition, precious metals as a group had a very capitulatory looking week, and gold, silver, copper, and platinum all registered gains on Friday.