INK Canadian Insider Index holds 1071 as markets, copper dive
Thank you for joining us in a weekly technical look at the mid-cap oriented INK Canadian Insider (CIN) Index. Last week, the INK CIN saw a strong initial surge from heavily oversold conditions, rising as high as 1093.97 intraday. However, the Index could not hold those gains amid weakness in world markets, and it pulled back steeply to 1071.95. It did, however, manage a nominal gain of 0.94 points or 0.1% over the prior week.
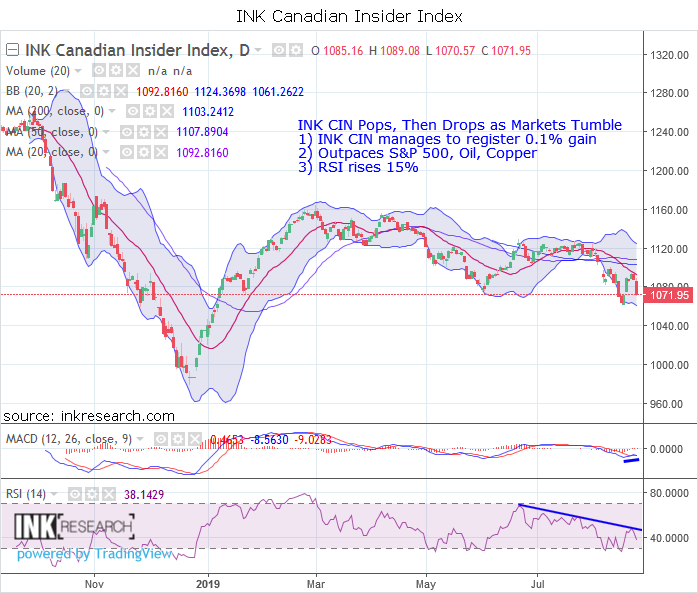
MACD shot up 5 points to 0.46. RSI rose 5 points or 15% to 38.14. This is a key week. For if RSI can hold at these levels by the end of the week, it will print a higher low and become a bullish indication for the Index. Note that there is a sloping downtrend line (in blue) at around 50 RSI that the INK CIN needs to overcome to really break out of its funk.
Support is at 1071 and 1061.26 (lower Bollinger band). Resistance is at 1094 and 1103.24 (200-day moving average).
The Index underperformed red-hot silver which shot up another 1.7% and gold which rose 0.92%. However, the INK Canadian Insider Index notably outpaced the SPDR S&P 500 ETF (SPY*US) which lost 1.38%, Crude Oil which fell 1.13%, and Copper which was hammered 2.5%. Will the Index yet see a flush back to its lower Bollinger bands before an upside reversal? Or are global markets and copper already oversold enough to generate a widespread rebound? Stay tuned.
The INK Canadian Insider Index is used by the Horizons Cdn Insider Index ETF (HII).