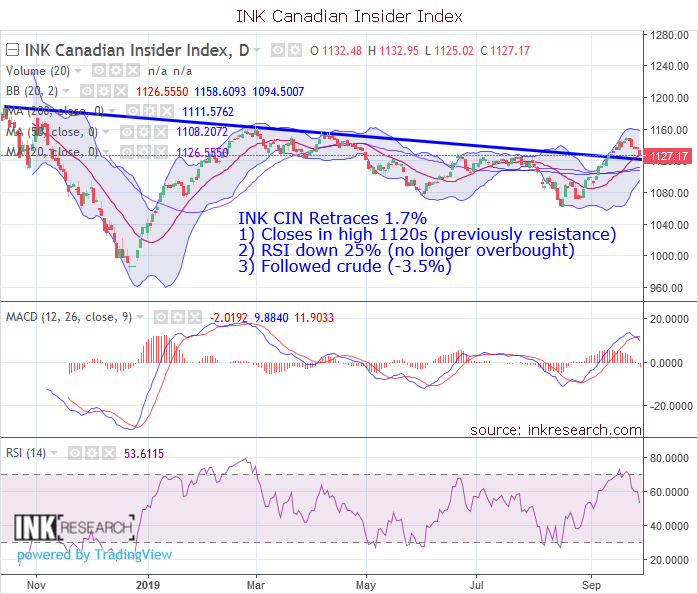
INK Canadian Insider Index takes a breather, retraces 1.7%
Thank you for joining us in a weekly technical look at the mid-cap oriented INK Canadian Insider (CIN) Index. Last week, the INK Canadian Insider Index took a breather following its month-long price surge. The Index did initially make a new 5-month intraday high at 1149.46 but pulled back 20.5 points or 1.7% to 1127.12.

MACD dipped 5.8 points to -2. RSI fell 25% or 18.2 points to 53.6 and worked off its prior overbought condition.
Support is at 1111.58 (200-day moving average) and 1126.55 (lower Bollinger band). Resistance is now at 1150 and 1158.61 (upper Bollinger band).
The INK Canadian Insider Index outperformed Crude Oil (-3.75%) but trailed copper (-0.35%), gold (-0.35%), silver (-1.1%), and the SPDR S&P 500 ETF (SPY*US) which was down 0.97%. The Index now has an opportunity to build on its recent momentum having worked off its high overbought RSI reading. The next week or two is key, for we will see whether the INK CIN can hold in the upper-1120s which previously served as overhead resistance.
The INK Canadian Insider Index is used by the Horizons Cdn Insider Index ETF (HII).