Investors Should Ignore Gold/Oil 'Danger Signal'
Bears suggest that falling oil, rising gold is bad news for stocks.
A closer look reveals that the danger signal isn't as bad as it seems.
Leading indicators of recession aren't confirming that danger looms.
The pronounced divergence between gold and oil prices has triggered alarm bills for some bearish investment advisors and traders. Recently there have been warnings from some analysts that whenever a sizable spread has developed between both commodities in the past, it has resulted in a plunging stock market. In today's report, we'll examine this historical correlation as I make the case that equity investors have nothing to fear from soaring gold and falling crude oil.
Among the many vagaries of the market's volatile climate has been the conspicuous divergence between oil and gold prices. Gold prices have recently been on a rip-and-tear as panicked investors head for the proverbial hills and run to the perceived safety of the yellow metal. Along with U.S. Treasury bonds and the Japanese yen, gold has benefited from the flight to safety among investors frightened by the latest developments in global trade.
The August gold futures chart shown here is a testament to just how strong the urge for safety has been in just the last few days since President Trump threatened to raise tariffs on Mexican imports. Gold has risen 5% on an intraday basis since last week, a remarkable run for the normally stodgy metal.
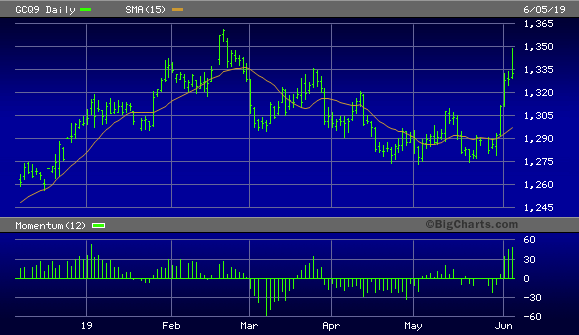
Source: BigCharts
Crude oil prices, by contrast, have plunged during the same period. Oil is down some 15% since peaking in late April, a move which some analysts have blamed on a diminished outlook for the global economy. Crude oil has given back most of its gains during the January-April rally and is threatening to decline even more as investors fear falling demand for industrial commodities in general.
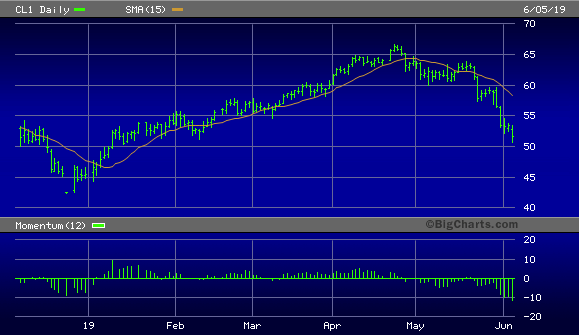
Source: BigCharts
The simultaneous decline in oil prices while gold rallies hasn't escaped the notice of some astute observers. One such observer is Tavi Costa of Crescat Capital, who recent noted that there have been only three times in the past when oil priced plunged while gold prices rose at the same time. All three times occurred during "severe bear markets and recessions", according to Costa. He believes that the latest occurrence of this gold/oil divergence signal could witness another powerful downside move in the stock market.
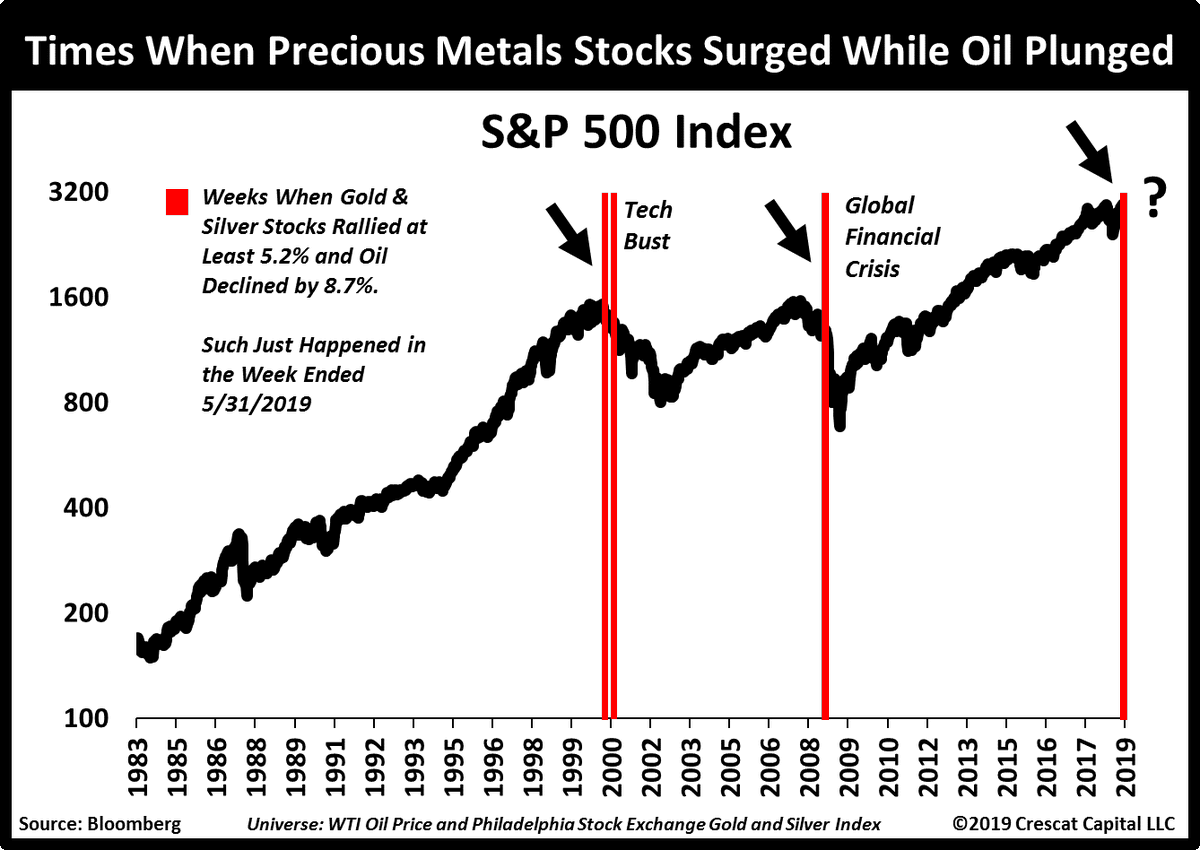 Source: MarketWatch
Costa was quoted by Shawn Langlois of Marketwatch as saying:
Gold-to-oil ratio surging, copper prices getting annihilated, corporate spreads widening, and credit markets [are] screaming recession ahead."
Let's examine this claim in greater depth. To begin with, corporate spreads have widened slightly in recent days but have hardly reached levels which have historically signaled the onset of economic problems. One of the more reliable credit spread indicators is the ICE BofAML U.S. High Yield Master II Option Adjusted Spread. Although it has been rising lately, it's still considerably below the levels which were hit immediately before the last major shakeup in the credit market. I'm referring to the energy bond market collapse of 2015, which resulted in the U.S. narrowly avoiding recession. At its recent levels, the BofAML High Yield Spread hardly suggests the credit market is in danger, let alone the imminent threat of a recession.
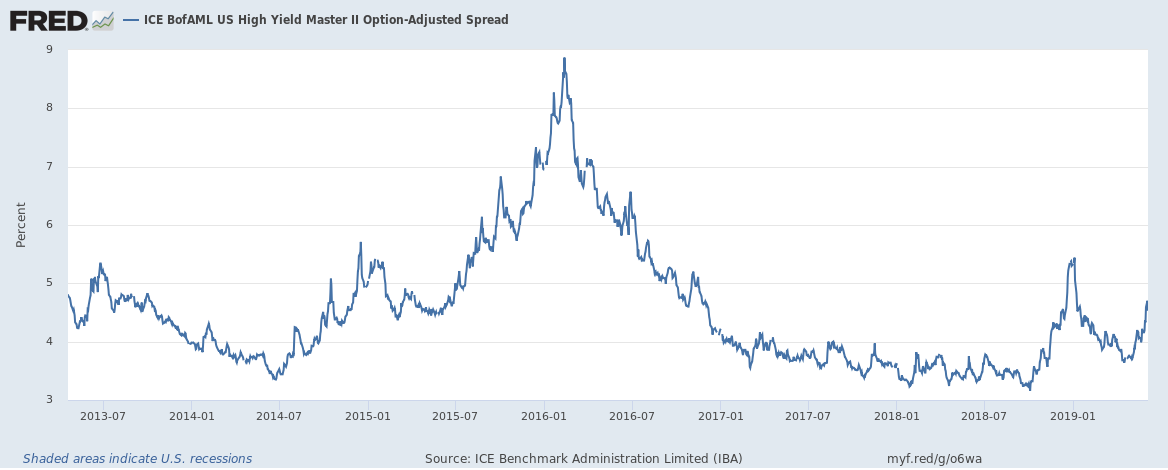 Source: St. Louis Fed
As for the contention that copper prices are being "annihilated", this could be considered an exaggeration based on the recent past performance of this important industry metal. Falling copper prices are certainly worthy of consideration when analyzing the economy, but some perspective is in order. While copper has fallen around 13% since April, it fell by a far greater amount last summer with no recession resulting from it. What's more, the copper price is still up by 30% since the last major bottom in 2016. It should further be pointed out that copper prices fell steadily and significantly from 2011 until 2016 with no obvious danger to the U.S. economy.
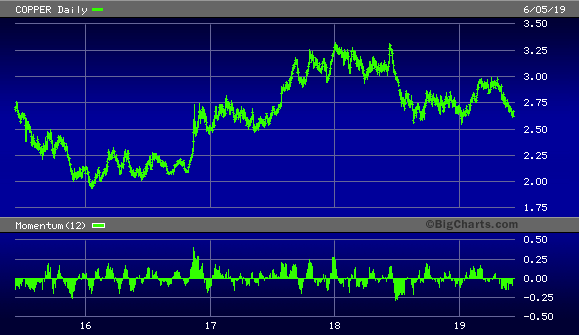
Source: BigCharts
Meanwhile, the latest gold price rally has hardly suggested that the gold market foresees serious economic danger ahead. For one thing, if recession were a serious threat it would be probable that gold prices would be falling along with oil. This was the case prior to the last recession and is normally the case when the stock market is facing serious danger. The reason for this is that in the rush to raise cash, gold usually gets liquidated by panicky investors along with everything else. It's only when the stock market has bottomed after a collapse that gold usually comes into its own and kicks off a sustainable bull market.
Another consideration is that while gold has rallied upwards of 5% since last week, the prices are still well below the highs of recent years. Indeed, from the vantage point of the long-term chart, the latest gold rally appears as merely a proverbial "blip" on the radar.
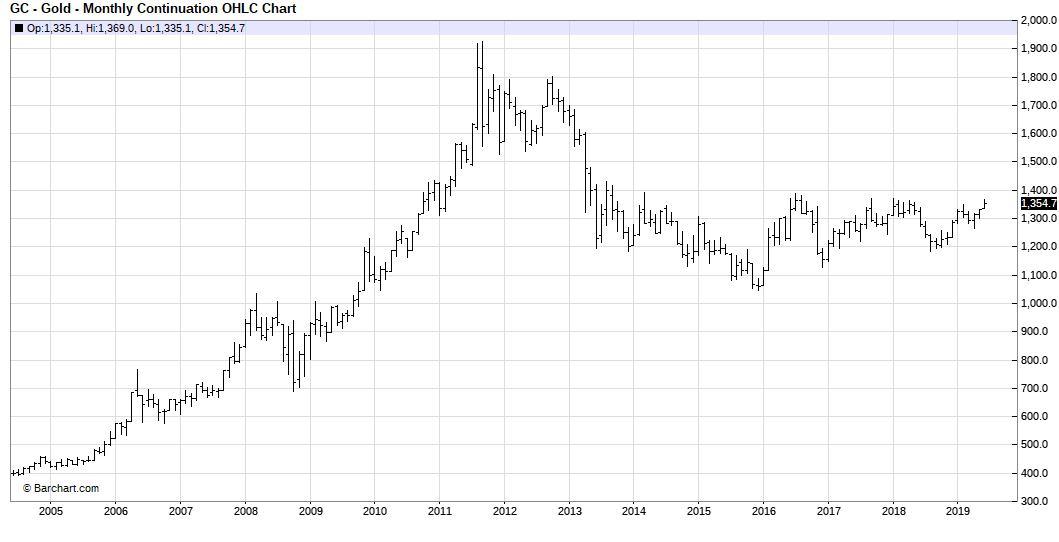
Source: BarChart
The latest gold rally should be considered mainly as an emotional reaction to the recent tariff threat from the Trump administration. And while the gold price may well continue to rally in the coming days, this should be seen as proof that neither the stock market nor the economy are in imminent danger of collapse.
I would also point out that while the U.S. equity market still faces near-term headwinds from the ongoing tariff dispute with Mexico and China its fundamental position is strong enough to see it through the choppy trading environment we're now seeing. It's also true that the NYSE broad market remains weak on a short-term basis, based on the fact that an above-normal amount of stocks have made new 52-week lows. On the Nasdaq, meanwhile, the new 52-week highs-lows differential remains negative as of June 5, with more new lows than highs. The new highs and lows are my favorite measure of incremental demand for equities, and the 4-week rate of change in the NYSE highs-lows (below) suggests that the stock market isn't quite out of the woods yet on a short-term basis.
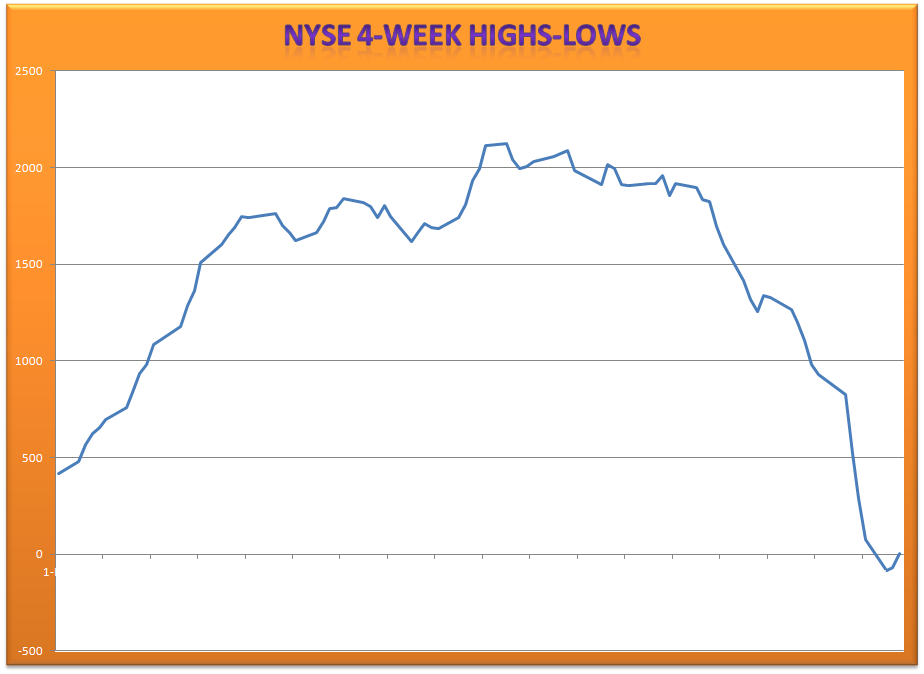
Source: WSJ
However, the 120-day rate of change for the NYSE highs-lows is the instrument I use to gauge how much forward momentum is present within the broad market on an intermediate-term (3-6 month) basis. And as you can see here, there's still plenty of forward momentum left to keep equity prices from collapsing. This chart is one reason why I believe stock investors should avoid the temptation to turn bearish right now. It holds out the distinct possibility that the major averages will soon find their footing and eventually reverse the losses of the past month.
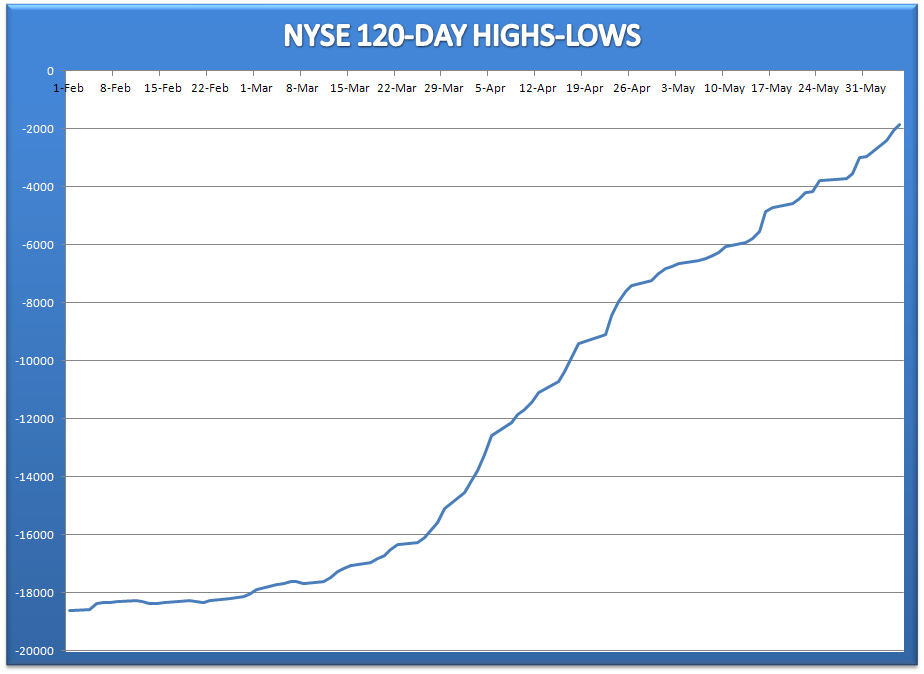
Source: WSJ
In light of the recent setback in the equity market and the uncertainty generated over U.S. trade policy, it's quite tempting to entertain the worst-case-scenario for stocks and the economy. There has already been an increase in "doom-and-gloom" outlooks among many bearish financial analysts, and I expect many more such negative messages will be seen in the coming weeks. Nonetheless, the indicators we've discussed in this report provide us with no reason for serious alarm. Based on the prevailing strength in forward earnings and revenues for S&P 500 companies, investors are justified in maintaining a bullish intermediate-term outlook on equities. I also urge investors to ignore the latest gold/oil "danger signal" and instead focus on building a watch list of fundamentally sound bargain stocks for when the next market bottom has been confirmed. Investors should also refrain from initiating new long positions in individual stocks until the new 52-week lows on the NYSE and Nasdaq shrink from their present elevated levels.
On a strategic note, my trading position in my favorite market-tracking ETF, the Invesco S&P 500 Quality ETF (SPHQ), was stopped out on May 10 after the ETF fell under the $31.70 level on an intraday basis, triggering my stop loss. This put me back in a cash position in my short-term trading portfolio. Meanwhile, investors can maintain longer-term positions in fundamentally sound stocks in the top-performing real estate and utilities sectors as we wait for the latest short-term market weakness to dissipate
Disclosure: I am/we are long GDX. I wrote this article myself, and it expresses my own opinions. I am not receiving compensation for it (other than from Seeking Alpha). I have no business relationship with any company whose stock is mentioned in this article.
Follow Clif Droke and get email alerts