Is Crude Oil Firmly on the Upswing Now? / Commodities / Crude Oil

It appearedthat the bears firmly took the reins of yesterday’s session, but most of theirgains were history before the closing bell. Have we seen an important turningpoint for oil?
Let’s startwith the daily chart examination (charts courtesy of http://stockcharts.com and http://stooq.com ).
Crude oil opened yesterday’s session with the greenbullish gap that’s slightly below the 61.8% Fibonacciretracement. Although the bulls took the commodity a bit higherafter the market open, this strong resistance encouraged the sellers to act.
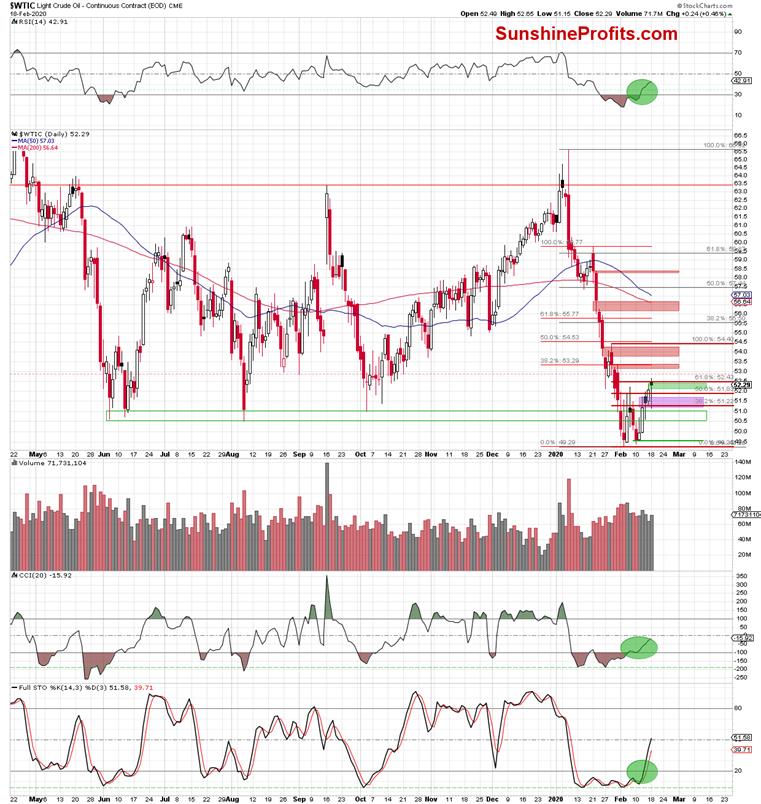
As a result, the price of black gold moved sharplylower and tested the strength of the pink bullish gap created in the previousweek. As it turned out, the bulls were active in this area, and prices staged acomeback. This way, the buyers erased almost the entire earlier decline andclosed the day slightly below the opening price.
As a result, the commodity created a bearish candlestickformation – the hanging man about which you could read more in our Tuesday’salert. Nevertheless, as we mentioned in one breath, this is asingle-candle formation, and as such it requires confirmation.
Did yesterday’s price action change anything in the oilshort-term picture? In our opinion, not really, because light crude closed the previoussession still below the 61.8% Fibonacci retracement.
Has there been any kind of a very short-term change incrude oil futures before today’s market open? Let’s take a look at the chartsbelow to find out.
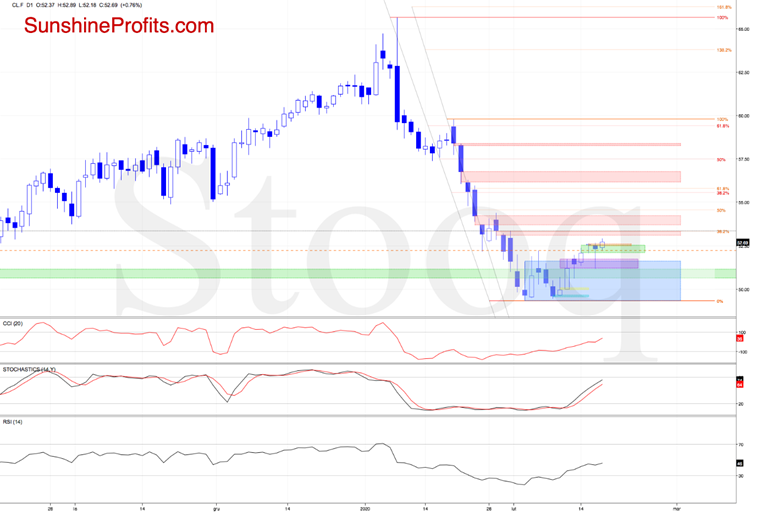
The futures opened today 8 cents above yesterday’sclose, creating another bullish gap. This positive development triggeredfurther improvement in the following hours, which resulted in a fresh weeklyhigh and a climb above the bearish orange gap created on Tuesday.
This move also brought the futures above the 61.8%Fibonacci retracement.
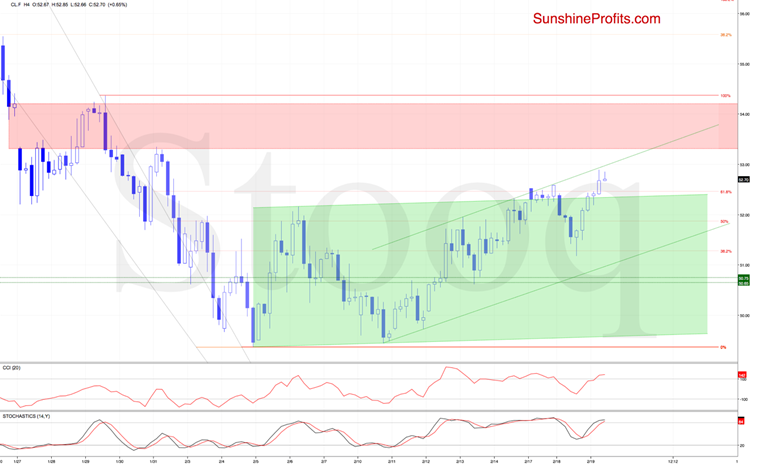
However, as long as there is no daily close above thisresistance, another reversal from here and a decline are likely – especiallywhen we take into account these two factors. First, it’s the position of the4-hour indicators – they are quite close to flashing their sell signals again.Second, it’s the proximity to the green resistance line, which runs parallel tothe one based on last week’s lows.
Connecting the dots, should the futures move lower inthe following hour(s) and the bears manage to invalidate the earlier small breakout above the 61.8% Fibonacci retracement, what would be the bears’ target? We’lllikely see a test of yesterday’s low and the above-mentioned green support linebased on the last week’s lows in the very near future.
Summingup, it seems more likely than not that crude oil isgoing to decline once again, however given yesterday’s strength betting onlower crude oil prices seems too risky at this moment. Moreover, please notethat the USD Index and crude oil have been moving in the opposite directionssince the beginning of this year, and since the USD Index might be starting apullback shortly, perhaps crude oil would move sideways or slightly higherbefore continuing to decline. When in doubt, stay out.
If youenjoyed the above analysis and would like to receive free follow-ups, we encourageyou to sign up for our daily newsletter – it’s free and if you don’t like it,you can unsubscribe with just 2 clicks. If you sign up today, you’ll also get 7days of free access to our premium daily Oil Trading Alerts as well as Gold& Silver Trading Alerts. Signup now.
Nadia Simmons
Forex & Oil Trading Strategist
PrzemyslawRadomski
Founder, Editor-in-chief
Sunshine Profits: Gold & Silver, Forex,Bitcoin, Crude Oil & Stocks
Stay updated: sign up for our free mailing listtoday
* * * * *
Disclaimer
All essays, research andinformation found above represent analyses and opinions of Nadia Simmons andSunshine Profits' associates only. As such, it may prove wrong and be a subjectto change without notice. Opinions and analyses were based on data available toauthors of respective essays at the time of writing. Although the informationprovided above is based on careful research and sources that are believed to beaccurate, Nadia Simmons and his associates do not guarantee the accuracy orthoroughness of the data or information reported. The opinions published aboveare neither an offer nor a recommendation to purchase or sell any securities. NadiaSimmons is not a Registered Securities Advisor. By reading Nadia Simmons’reports you fully agree that he will not be held responsible or liable for anydecisions you make regarding any information provided in these reports.Investing, trading and speculation in any financial markets may involve highrisk of loss. Nadia Simmons, Sunshine Profits' employees and affiliates as wellas members of their families may have a short or long position in anysecurities, including those mentioned in any of the reports or essays, and maymake additional purchases and/or sales of those securities without notice.
© 2005-2019 http://www.MarketOracle.co.uk - The Market Oracle is a FREE Daily Financial Markets Analysis & Forecasting online publication.