Is Gold Price Action Warning Of Imminent Monetary Collapse?
By Hubert Moolman
22 April 2019
During the 2008 financial crisis the Fed significantly increased the US monetary base to keep the system from collapse. They are currently in a similar situation, and have done (is doing) the exact same thing.
Here is a chart of the US monetary base to illustrate the similarity:
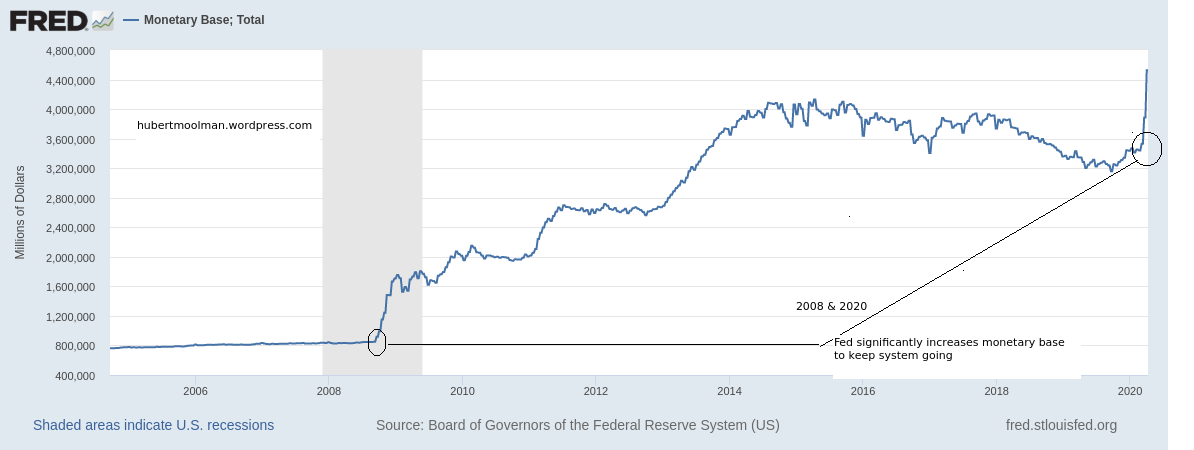
With the 2008 actions they were able to avoid the collapse until now. Will the current actions yield the same results, or will we see a completely different outcome?
One thing to look at for this answer is Gold (probably one of the most important things).
So, when the Fed increased the monetary base of the US significantly in 2008, it took Gold prices quite a long time to show price increases to catch up with the monetary base. Then, the Fed doubled the monetary base in a period of about four months. However, from around the same time the Gold price took almost three years to double, thereby only catching up very late in the game.
Gold was not crying system collapse, and rightly so.
That shows that there was still a decent amount of faith and resource in the monetary system to be able to continue. Here is a chart that tracks the Gold price relative to the US monetary base (Gold price/US monetary base in millions):
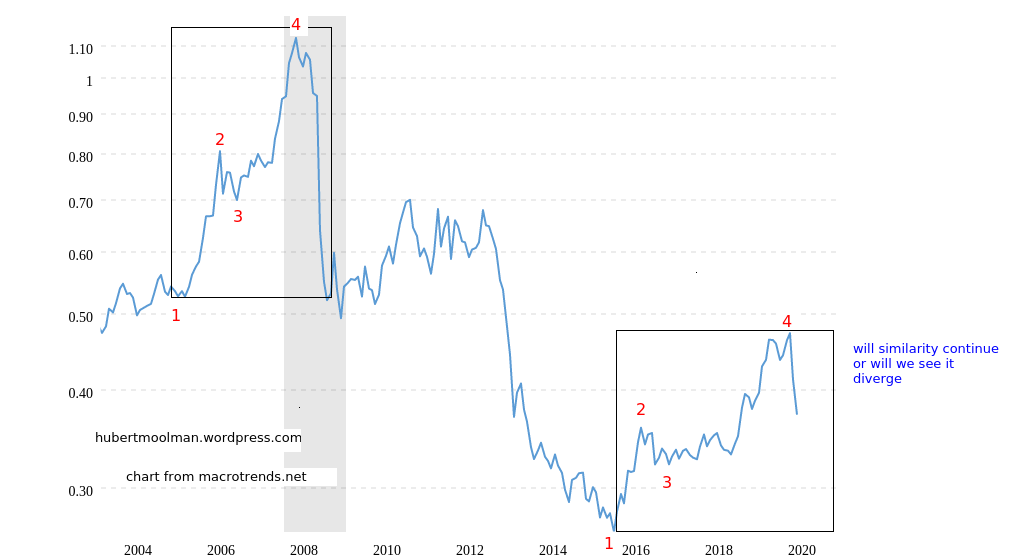
Point 4 in 2008 is where the Fed increased the monetary base significantly. The massive decline to lower than point 1, shows that the Gold price did not keep up with the US monetary base.
So, although Gold was going up during that same period, it was not warning of system collapse. There were two other periods in history that similar situations occurred, but gold actually was warning of a system collapse (or system bank run, if you will)
Those times were in 1933 and 1971, and you can read more about those (and the above chart) here. Both of those occasions resulted in a system reset.
In the chart above, there are two patterns marked out (1 to 4). The current pattern appears to follow the earlier pattern. If the similarity continues, then there is a good chance that the outcome of the current crisis will be like the 2008 one.
If there happens to be divergence from the earlier pattern, and Gold outruns the monetary base increase (by the chart going higher than point 4 over the coming months), then we are likely to see a radically different (and worse) outcome to the 2008 financial crisis.
For more on this and additional analysis, you are welcome to subscribe to my premium service. I have also recently completed a Silver Fractal Analysis Report as well as a Gold Fractal Analysis Report.