Is It Time to Buy Silver Miners? The Gold:Silver Price Ratio Says YES!
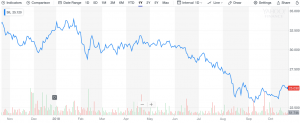
The above chart is a 20-year snapshot that covers the Gold to Silver price ratio. It measures the number of silver ounces are needed to purchase a single ounce of gold. This bellwether indicator has crossed into new territory and is currently fluctuating between 85 and 83, which is significantly higher than the normal range.
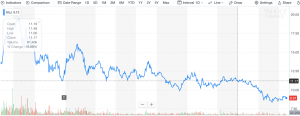
Below is a 1-year chart for the Global X Silver Miners ETF, which tracks the Solactive Global Silver Miners Total Return Index.
The Solactive Silver Miners Index tracks the prices of silver stocks, includes between 20 and 40 international companies that are active in the exploration, mining, and refinement of silver. The bottom line is that the price of silver stocks are at or near their 52-week lows, the Gold Silver Price Ratio is at a 20 year high, this would seem to be a strong indicator that silver and silver stocks are both undervalued.
As you can see above, this is the 1-year chart for the Prime Junior Silver ETF, which measures junior silver stocks. The index shows that junior silver stocks are trading well below their 52-week high and near the 52-week lows.