Is the Worst Behind for Crude Oil Bears? / Commodities / Crude Oil

Crude oil made yesterday another hesitant move higher. Also yesterday, wementioned here the saying regarding gravity. Sometimes, it takes patience forthe underlying forces to win out. Or, doesn't the oil market rather remind youmore of a coiled spring actually? Accordingly, what is the position favoredmost by the odds right now?
Let’s takea closer look at the charts below (charts courtesyof http://stockcharts.com).
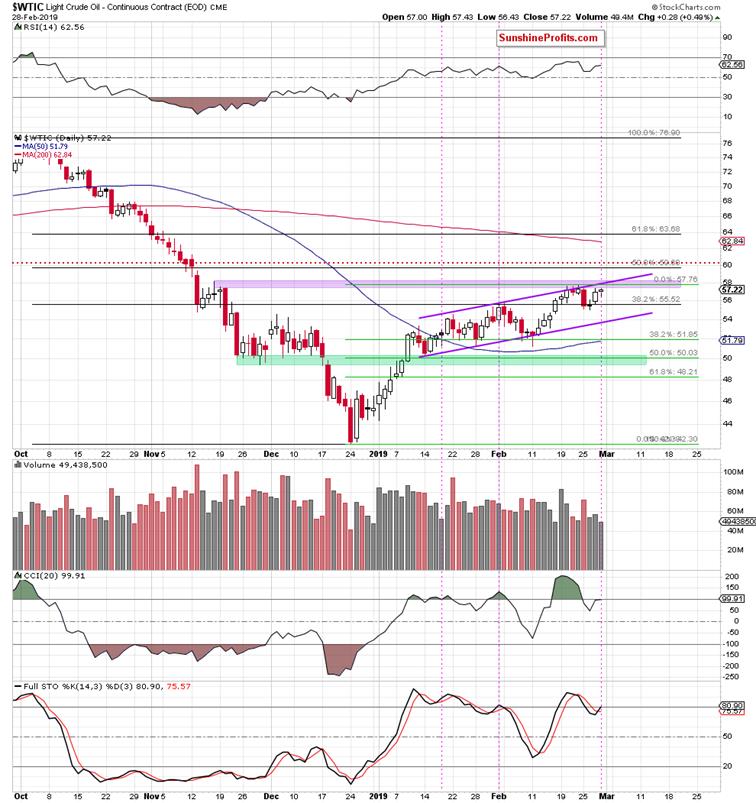
Looking atthe daily chart, we see that the commodity is still trading below two nearest resistances: the upper border of the purple rising trendchannel and the purple resistance zone. Just like you could read in ourprevious OilTrading Alerts. Additionally, yesterday’s upswing materialized on smaller volue than day earlier. Combined with yesterday’sprice compression and today’s hesitation (upside move has again been rejectedand black gold changes hands at around $56.25 currently), this further underlinesbuyers’ weakness.
Taking theabove into account, we could summarize today’s alert with a simple sentence:nothing has changed from technical point of view.
Not sofast.
Take agood look at the above chart once more. There is one potentially importantchange – the Stochastic Oscillator has generated its buy signal. How dependableis that actually?
We haveseen two similar cases previously and they’re marked with pink vertical dotedlines. We see that the invalidation of the sell signal generated by thisindicator preceded fresh peaks in the oil price. A close examination of such asuperficially similar occurance is therefore warranted.
Let’s takea look at the daily chart below once again, but this time from a bit differentpoint of view.
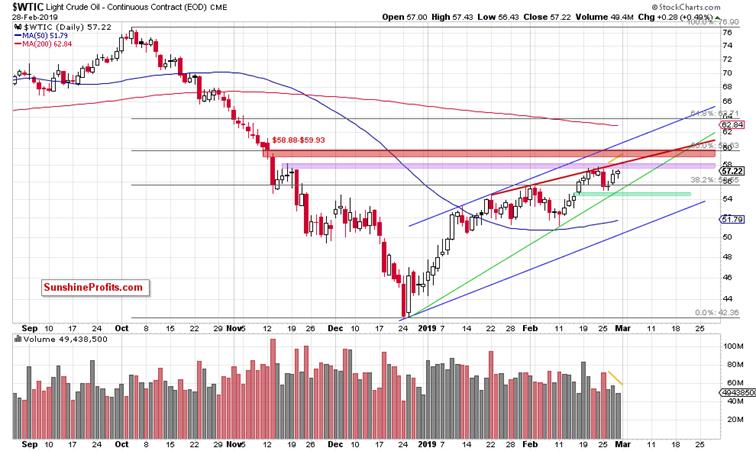
You cansee that we have removed the above mentioned purple rising trend channel. Wehave added these additional elements:
The blue rising trend channel based on the peaks and the lows of theDecember-February upward moveThe red zone created by the gap between the November 12, 2018 candle andthe following session, which serves as the next resistanceThe red resistance line based on the January 22, January 31 and earlyFebruary peaks, which was strong enough to stop the oil bulls also in a weekago The green zone, created by the green gap between February 14 and thefollowing session The green support line based on the late-December 2018 and February 11,2019 lows, which together with the above mentioned green gap serves as thenearest supports for the oil priceStill onthe above chart, you can see that the 50% Fibonacci retracement (based on theentire October-December downward move) reinforces the strength and theimportance of the red gap between $58.88 and $59.93.
For thesake of curiosity now, let’s explore another part of the analytical universe.It’s our habit to approach the markets using different toolboxes and presentyou with the clearest perspective possible. Everywhere, not only in OilTrading Alerts. Let’s dive in.
Enjoy thejourney of looking at the price movements through the optics of ElliottWave technicians.
They wouldsee this potential scenario for the coming week emerging.
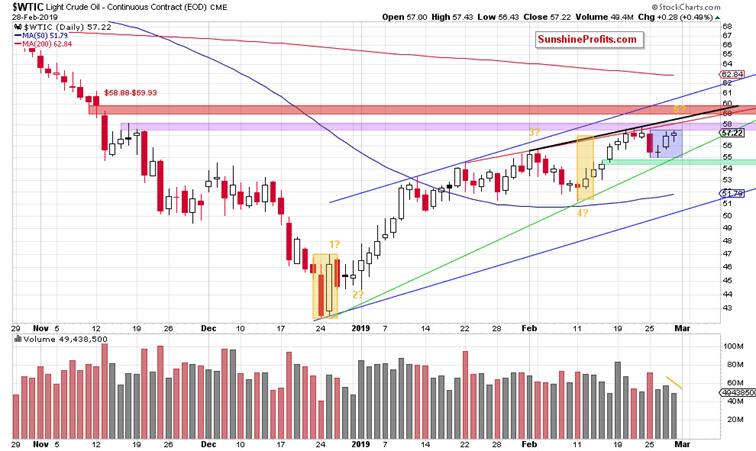
Note thetwo yellow rectangles which show that the upward move between the February 11low and the last week’s peaks was quite similar to the first upward move afterthe December low.
Such priceaction suggests that we could observe the last impulse wave according to theElliott Wave Theory. It says that the first and the fifth waves are quitesimilar (in our case not in time, but probably in the length). If this is thecase, crude oil can still hit one more fresh peak, which will precede a biggermove to the downside.
Why isanother fresh high possible?
If wecorrectly marked the waves of the upward December-February move, light crude iscurrently forming the fifth smaller wave within a bigger fifth (marked on theabove chart with 5?) wave. In other words, if all the above assumptions arecorrect, the last peak is still ahead of us. One more note regarding themarkings and assumptions – within Elliott Wave Theory, the wave counts and markingscan change as the chart progresses to be in line with the underlying priceaction. The market decides – the waves structure, type and precedence of waves.
How highcan the commodity go?
Lightcrude can test the above-mentioned red resistance line, which currentlyintersects the upper border of the purple resistance zone. Here, the size ofthe fifth impulse wave would be equal to 150% of the first wave. Nevertheless,if this area is broken, the next target would be around $58.74, where the fifthwave would be equal to 161.8% of the first wave, which is slightly below thered gap.
What couldhappen next?
In ouropinion, after a potential fresh peak, we’ll still see a drop to at least thegreen support line based on December and February lows, but it seems morelikely to us that we’ll see a decline to around $51.23-$52.30, where themid-February lows and the bottom of a potential fourth wave are.
If thesituation develops in line with the above scenario, we’ll likely increase thesize of our short position.
If youenjoyed the above analysis and would like to receive free follow-ups, we encourageyou to sign up for our daily newsletter – it’s free and if you don’t like it,you can unsubscribe with just 2 clicks. If you sign up today, you’ll also get 7days of free access to our premium daily Oil Trading Alerts as well as Gold& Silver Trading Alerts. Signup now.
Nadia Simmons
Forex & Oil Trading Strategist
PrzemyslawRadomski
Founder, Editor-in-chief
Sunshine Profits: Gold & Silver, Forex,Bitcoin, Crude Oil & Stocks
Stay updated: sign up for our free mailing listtoday
* * * * *
Disclaimer
All essays, research andinformation found above represent analyses and opinions of Nadia Simmons andSunshine Profits' associates only. As such, it may prove wrong and be a subjectto change without notice. Opinions and analyses were based on data available toauthors of respective essays at the time of writing. Although the informationprovided above is based on careful research and sources that are believed to beaccurate, Nadia Simmons and his associates do not guarantee the accuracy orthoroughness of the data or information reported. The opinions published aboveare neither an offer nor a recommendation to purchase or sell any securities. NadiaSimmons is not a Registered Securities Advisor. By reading Nadia Simmons’reports you fully agree that he will not be held responsible or liable for anydecisions you make regarding any information provided in these reports.Investing, trading and speculation in any financial markets may involve highrisk of loss. Nadia Simmons, Sunshine Profits' employees and affiliates as wellas members of their families may have a short or long position in anysecurities, including those mentioned in any of the reports or essays, and maymake additional purchases and/or sales of those securities without notice.
© 2005-2019 http://www.MarketOracle.co.uk - The Market Oracle is a FREE Daily Financial Markets Analysis & Forecasting online publication.