Is This Time Different? Predictive Power of the Yield Curve and Gold / Commodities / Gold & Silver 2019

 This time is different. This is what the expertssay. The inversion of the yield curve did a great job in predicting recessionsin the past, but the current inversion is not like the previous. The predictivepower of the yield curve has weakened, so it does not signal the recession.This is what the pundits claim. We invite you to read our today’s article andfind out whether the experts are right and what does it mean for the goldmarket.
This time is different. This is what the expertssay. The inversion of the yield curve did a great job in predicting recessionsin the past, but the current inversion is not like the previous. The predictivepower of the yield curve has weakened, so it does not signal the recession.This is what the pundits claim. Are they right?
First of all, many doubt whether we can reallytrust the signals sent by the yield curve, given that the centralbanks heavily intervened in the bond markets in the aftermath of the GreatRecession.When the short-term interest rates reached almost zero, the Fed started to buy many securities to lower the long-term yields,which flattened the yield curve. So it might be the case that without the U.S.central bank’s impact on the bond prices, the yield curve would be steeper oreven not inverted. In other words, it might be the case the yield curve isinverted only because the long-term rates are artificially compressed. If true,the yield curve can be inverted even if short-term interest rates remain stimulative to the realeconomy (they are not above the ‘true’ level of long-term yields which reflectthe neutral rates) and thus are not serving to depress activity.
While this reasoning is plausible, there are two problems with it. First, the Fed ended its quantitative easing program long time ago, and it has been conducted recently quantitative tightening. Second, thereis a lot of uncertainty around the effects of QE on interest rates. Hence, as the San Francisco Fed economistsnoted,
thereis no clear evidence in the data that ‘this time is different’ or thatforecasters should ignore part of the current yield curve flattening because ofthe presumed macro-financial effects of QE.
Second concern about thecurrent predictive power of the yield curve refers to easy financial conditions. The inverted yield curve should reflect tightenedfinancial conditions and desperate entrepreneurs scrambling for funds, biddingup short-term rates. But, as the chart below show, the financial conditionsremain easy (negative values indicate financial conditions that are looser thanaverage).
Chart 1: Yieldcurve (green line, spread between 10-year and 3-month Treasuries, monthlyaverages, in %) and the Chicago Fed National Financial Conditions Index (blue line,index) from January 1971 to June 2019.
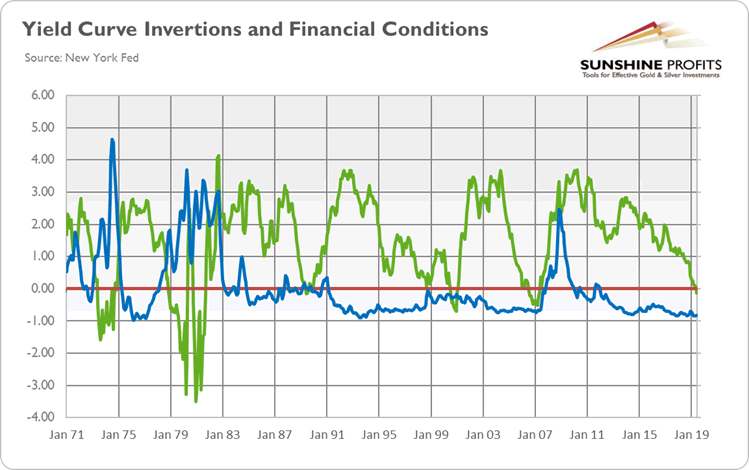
That’s true. However, the financial conditions arevery often a lagging indicator, as banks turn off the credit tap only after thecrisis come. Liquidity is an illusoryconcept. It may seem to be abundant and always just there, but when marketstress occurs, liquidity often disappears. Please take one more look at thechart above. The financial conditions become positive, i.e., tighter than onaverage, only in November 2007, just one month before the Great Recession officially began. And during the 2001 recessionwhich occurred after the burst of the dot-com bubble, the financial conditions remained easy all thetime!
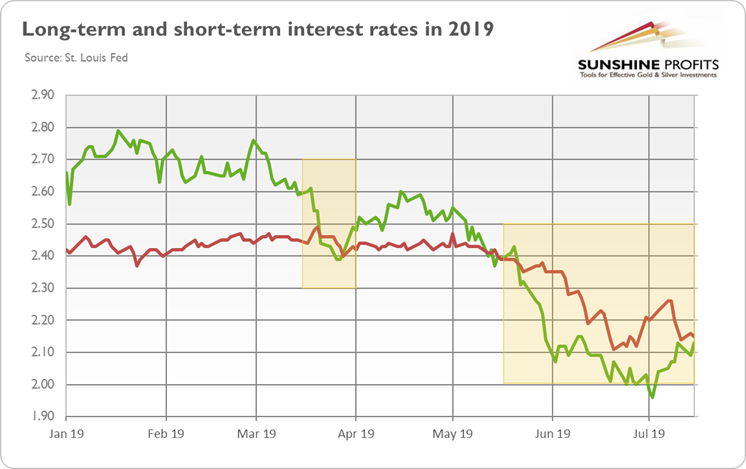
Third, whatabout the reason behind the recent inversion of the yield curve? In theApril edition of the Gold Market Overview, we pointed out that the March inversion of theyield curve happened not because the short-term interest rates rose abruptly,as the Fed tried to stop the overheating of the economy andprevent the rise of inflation, but because the long-term bondsyield declined, as investors became more pessimistic and startedto expect interest rates to be lower in the future.
We were right. Theimmediate reason behind the March inversion was the drop in the long-terminterest rates, as the chart below clearly shows. The same applies to theMay inversion. Actually, that case was even more counterintuitive, as theshort-term interest rates declined, not rose! The yield curve inverted becausethe long-term yields plunged even more.
Chart 2: Long-term interest rates (green line,10-year Treasuries) and short-term interest rates (red line, 3-monthTreasuries) from January 2015 to July 2019.
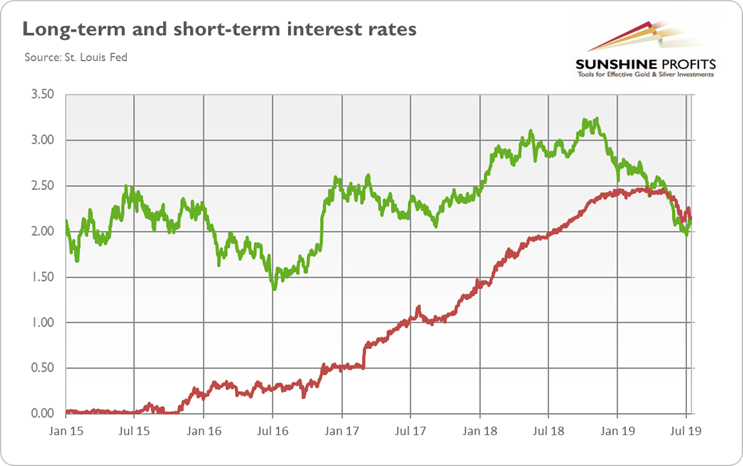
However, everything makes sense, when adopting along-term view. So, let’s take a look at the next chart, zooming out the bond yields.As one can see, the long-term interest rates remain in the sideways trend,while the short-term interest rates increased substantially since 2015 when theFed started its tightening cycle.
Chart 3: Long-term interest rates (green line,10-year Treasuries) and short-term interest rates (red line, 3-monthTreasuries) from January 2015 to July 2019.
Hence, everythingfits the standard theory of the yield curve inversion. But even if it doesnot, it does not matter, actually. According to the San Francisco Fed’s paperwe’ve already cited, inversion predictsslump, regardless of the driver. In other words, only the differencebetween the interest rates matters for recession predictions.
The bottom line is clear. The future cannot beguaranteed, but the past shows that eachtime the pundits reassured us that ‘this time is different’, they were wrong.As long as the yield curve remained flat but positive, we downplayedfearmongering about the imminent recession. When the yield curve invertedshortly in March, we were disturbed, but still far from panicking. But when thekey spread, calculated on a daily basis, dived deeper into negative territoryand for longer in May, while the monthly average inverted in June, we had toacknowledge that the recessionary odds in the US several months ahead increasedsubstantially. Precious metals investors should act accordingly, adjusting their portfolios to the heightened risk of recession.
If you enjoyed the above analysis, we invite you tocheck out our other services. We provide detailed fundamental analyses of thegold market in our monthly Gold Market Overview reports andwe provide daily Gold & Silver Trading Alerts with clearbuy and sell signals. If you’re not ready to subscribe yet and are not on ourgold mailing list yet, we urge you to sign up. It’s free and if you don’t likeit, you can easily unsubscribe. Sign uptoday!
Arkadiusz Sieron
Sunshine Profits‘ MarketOverview Editor
Disclaimer
All essays, research and information found aboverepresent analyses and opinions of Przemyslaw Radomski, CFA and SunshineProfits' associates only. As such, it may prove wrong and be a subject tochange without notice. Opinions and analyses were based on data available toauthors of respective essays at the time of writing. Although the informationprovided above is based on careful research and sources that are believed to beaccurate, Przemyslaw Radomski, CFA and his associates do not guarantee theaccuracy or thoroughness of the data or information reported. The opinionspublished above are neither an offer nor a recommendation to purchase or sell anysecurities. Mr. Radomski is not a Registered Securities Advisor. By readingPrzemyslaw Radomski's, CFA reports you fully agree that he will not be heldresponsible or liable for any decisions you make regarding any informationprovided in these reports. Investing, trading and speculation in any financialmarkets may involve high risk of loss. Przemyslaw Radomski, CFA, SunshineProfits' employees and affiliates as well as members of their families may havea short or long position in any securities, including those mentioned in any ofthe reports or essays, and may make additional purchases and/or sales of thosesecurities without notice.
Arkadiusz Sieron Archive |
© 2005-2019 http://www.MarketOracle.co.uk - The Market Oracle is a FREE Daily Financial Markets Analysis & Forecasting online publication.