Kirkland Lake Gold: A Path To Success
Kirkland Lake Gold posted revenues of $280.32 million for the fourth quarter of 2018, compared to year-ago revenues of $212.36 million.
Simple: I like Kirkland Lake Gold mainly because the company owns two outstanding mines that guarantee a steady success at least for the next three years.
I believe that Kirkland Lake Gold qualifies as a long-term investment due to its excellent balance sheet and its high-quality asset base.
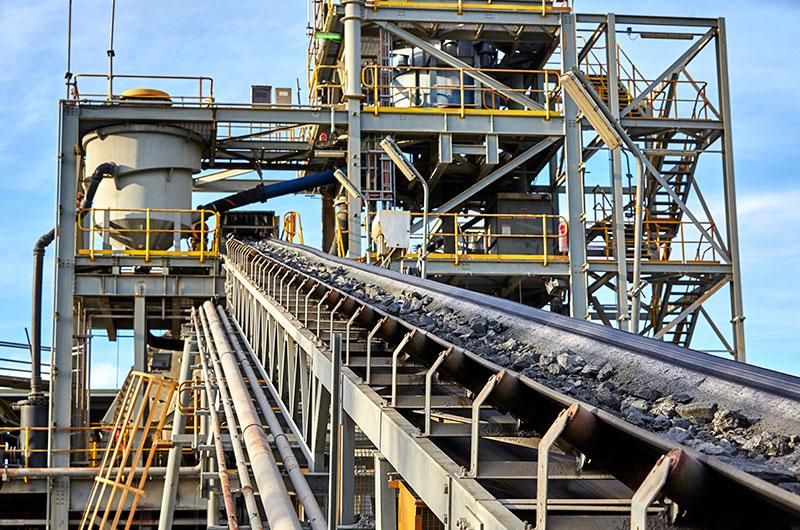
Source: Fosterville Mine from Kirkland Lake Gold.
Investment Thesis
The Toronto-based Kirkland Lake Gold (KL) is perhaps the most exciting mid-tier gold miners that we can find in the Gold industry. The business model is simple and based on two high grade, low-cost operations which secure the Company's production profile:
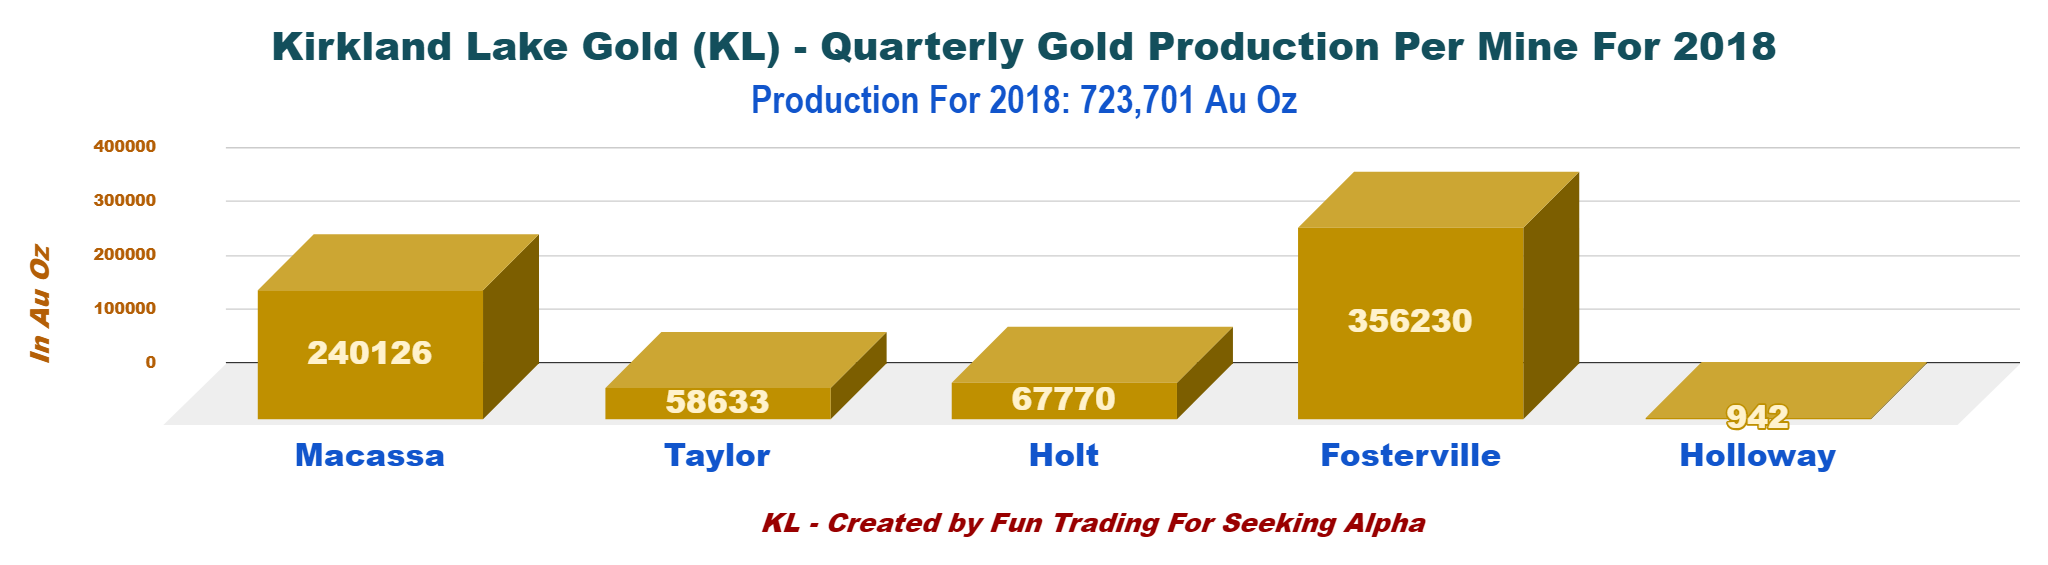
Macassa mine located in northeastern Ontario, Canada Fosterville mine located in the state of Victoria, Australia.Also, Kirkland Lake owns Taylor mine and Holt mine, both located in northeastern Ontario. The total gold production in 2018 was 723,701 Au Oz from the four producing mines and some residual from Holloway placed in care & maintenance.
Note: Kirkland Lake has placed on care & maintenance its two wholly-owned operations located in Australia Northern Territory (the Cosmo mine and Union Reefs mill) as well as the Holloway mine in Northeastern Ontario.
The investment thesis cannot be more elementary, and I support it by the need for investors to balance their stock portfolio by using a gold position as a hedge against a possible faltering of the world/US economy or a sudden weakness of the dollar.
While the US economy is doing well and the US dollar is very high as we speak, the risk of a turnaround for the worse later in 2019 is a growing potentiality.
To perform as an "insurance," we need to select healthy and robust companies which show a solid balance sheet and an exceptional long-term growth potential.
I believe that Kirkland Lake Gold qualifies as a unique contender due to its excellent balance sheet and its high-quality asset base with two great mines in Canada and Australia considered as "safe jurisdiction" for the mining industry.
Furthermore, Kirkland Lake Gold is also investing in Novo Resources and Osisko Mining.
The Company owned a total of 29.8 million shares of Novo, representing 18.2% of issued and outstanding common shares as of December 31, 2018. The Company acquired 32.6 million shares of Osisko Mining for $47.8 million, representing approximately 13.6% of currently issued and outstanding common shares.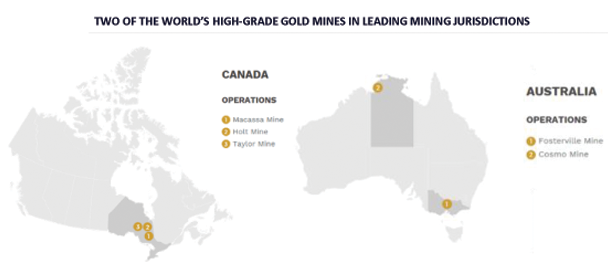
Source: KL Presentation
Tony Makuch, the CEO, said in the conference call:
We've had industry leading earnings and cash flow, $1 a share in earnings for the year. Free cash flow of $250 million, we performed extremely well against our guidance and we've also increased our guidance already this year and really fundamentally supported by strong growth in reserves that supports our focus or one of our core competencies in terms of exploration.
Kirkland Lake Gold: Financials And Production In 4Q 2018
| Kirkland Lake Gold | 1Q'16 | 2Q'16 | 3Q'16 | 4Q'16 | 1Q'17 | 2Q'17 | 3Q'17 | 4Q'17 | 1Q'18 | 2Q'18 | 3Q'18 | 4Q'18 |
| Total Revenues in $ Million | 84.58 | 91.69 | 100.83 | 130.90 | 168.53 | 189.89 | 176.71 | 212.36 | 198.24 | 214.65 | 222.70 | 280.32 |
| Net Income in $ Million | 9.65 | 10.64 | 18.88 | 3.47 | 13.13 | 34.57 | 43.74 | 40.98 | 50.04 | 61.49 | 55.88 | 106.54 |
| EBITDA (Company) $ Million | 30.95 | 31.36 | 45.17 | 45.22 | 66.60 | 94.75 | 99.34 | 93.63 | 105.62 | 123.11 | 119.23 | 187.80 |
| Profit margin % (0 if loss) | 11.4% | 11.6% | 18.7% | 2.7% | 7.8% | 18.2% | 24.8% | 19.3% | 25.2% | 28.6% | 25.1% | 38.0% |
| EPS diluted in $/share | 0.09 | 0.09 | 0.16 | 0.00 | 0.06 | 0.16 | 0.20 | 0.19 | 0.25 | 0.29 | 0.26 | 0.50 |
| Cash from operating activities in $ Million | 33.67 | 38.43 | 46.43 | 62.00 | 66.57 | 71.03 | 66.83 | 96.20 | 89.64 | 120.91 | 128.38 | 204.14 |
| Capital Expenditure in $ Million | 14.13 | 15.54 | 20.27 | 23.11 | 29.33 | 26.27 | 35.30 | 40.95 | 39.43 | 51.36 | 71.92 | 117.71 |
| Free Cash Flow (Company) in $ Million | 19.54 | 22.88 | 26.16 | 38.89 | 37.24 | 44.76 | 31.53 | 55.25 | 50.20 | 60.70 | 52.20 | 86.40 |
| Total Cash $ Million | 100.54 | 121.76 | 160.89 | 234.90 | 279.71 | 267.38 | 210.48 | 231.60 | 275.34 | 318.36 | 257.20 | 332.23 |
| Current and non-current LTD and capital lease in $ Million | 100.55 | 52.96 | 53.19 | 15.16 | 14.12 | 14.61 | 19.15 | 22.22 | 22.24 | 16.20 | 13.19 | 9.76 |
| Shares outstanding (diluted) in Million | 108.75 | 117.00 | 117.44 | 153.37 | 207.59 | 211.25 | 214.51 | 209.16 | 212.24 | 213.00 | 212.70 | 211.59 |
| Dividend per share $ | 0 | 0 | 0 | 0 | 0 | 0.008 | 0.016 | 0.016 | 0.023 | 0.023 | 0.03 | 0.03 |
| Production Au Oz | 1Q'16 | 2Q'16 | 3Q'16 | 4Q'16 | 1Q'17 | 2Q'17 | 3Q'17 | 4Q'17 | 1Q'18 | 2Q'18 | 3Q'18 | 4Q'18 |
| Total Production gold | 62,275 | 68,338 | 77,274 | 106,609 | 130,425 | 160,305 | 139,091 | 166,579 | 147,644 | 164,685 | 180,155 | 231,217 |
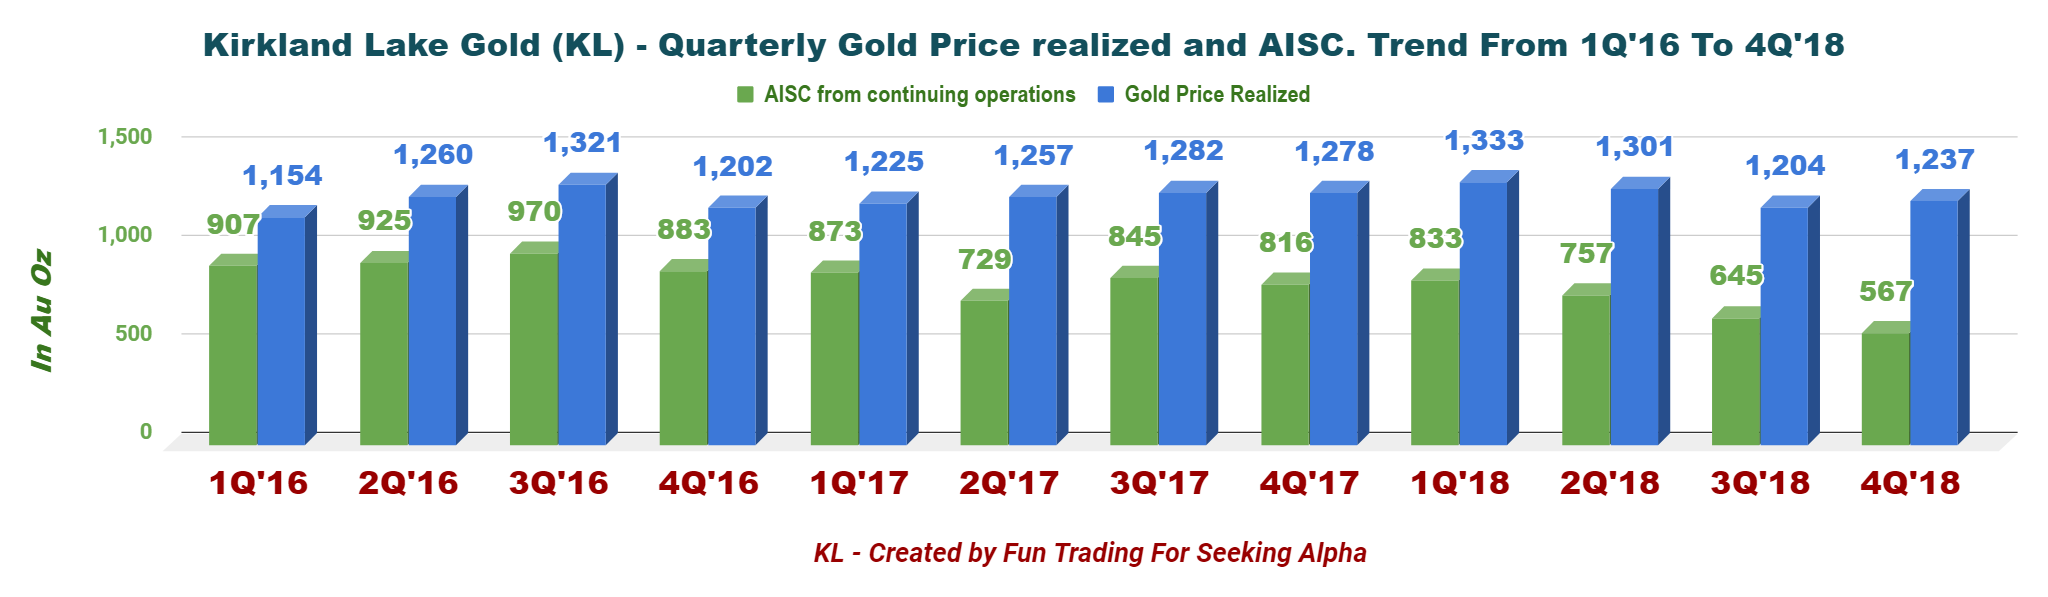
| AISC (co-product) from continuing operations | 907 | 925 | 970 | 883 | 873 | 729 | 845 | 816 | 833 | 757 | 645 | 567 |
| Gold Price | 1,154 | 1,260 | 1,321 | 1,202 | 1,225 | 1,257 | 1,282 | 1,278 | 1,333 | 1,301 | 1,204 | 1,237 |
Source: Company filings and Morningstar/Ycharts
One traditional way to confirm that Kirkland Lake Gold is qualifying as a long-term investment candidate is to analyze the financials in detail and look at historical financial performance.
It is what I generally do in Seeking Alpha when I present and analyze a gold or an oil company.
Trends And Charts: Revenues, Earnings Details, Free Cash Flow, Debt, And Production Details
1 - Revenues and trend. Impressive $280.32 million for the fourth quarter of 2018.
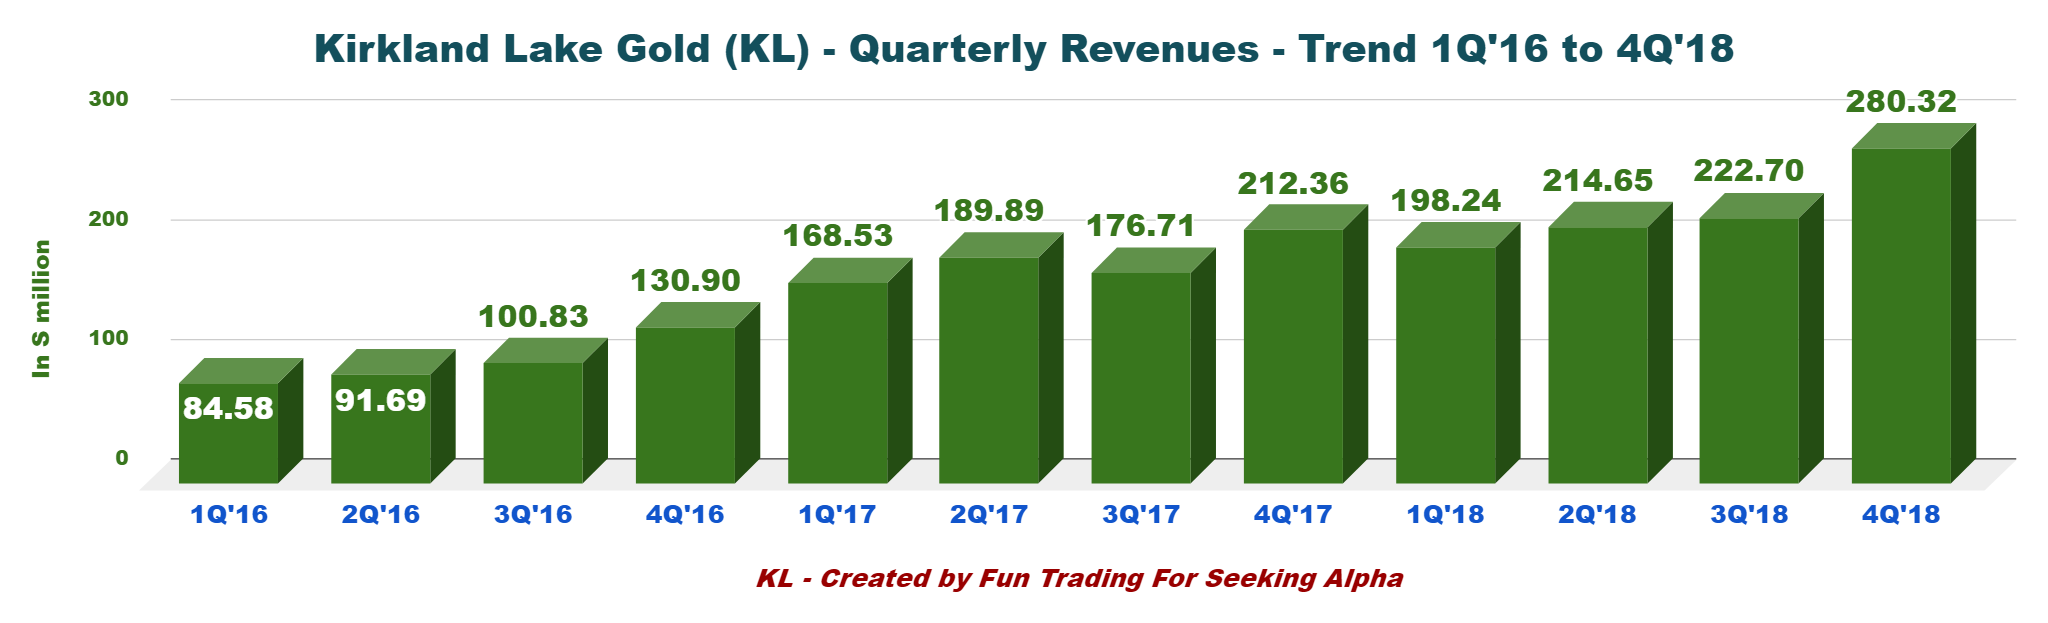 Kirkland Lake Gold posted revenues of $280.32 million for the fourth quarter of 2018, compared to year-ago revenues of $212.36 million. The company declared net earnings of $106.5 million or $0.50 per diluted share or adjusted net earnings of $109.6 million or $0.52/share. The increase since 2016 is very impressive as the graph above demonstrates.
EBITDA for the full year 2018 increased 49% year over year from 356.9 million to 531.6 million primarily driven by the increase in net earnings and a decrease in depletion and depreciation.
David Soares, the CFO, said in the conference call:
Looking at revenue for the full year, we saw a 23% increase from $747.5 million to $915.9 million and this is really over a period where gold price was relatively flat and this performance is driven mainly by the performance of sales increases at both the Fosterville and Macassa mines primarily.
2 - Free cash flow
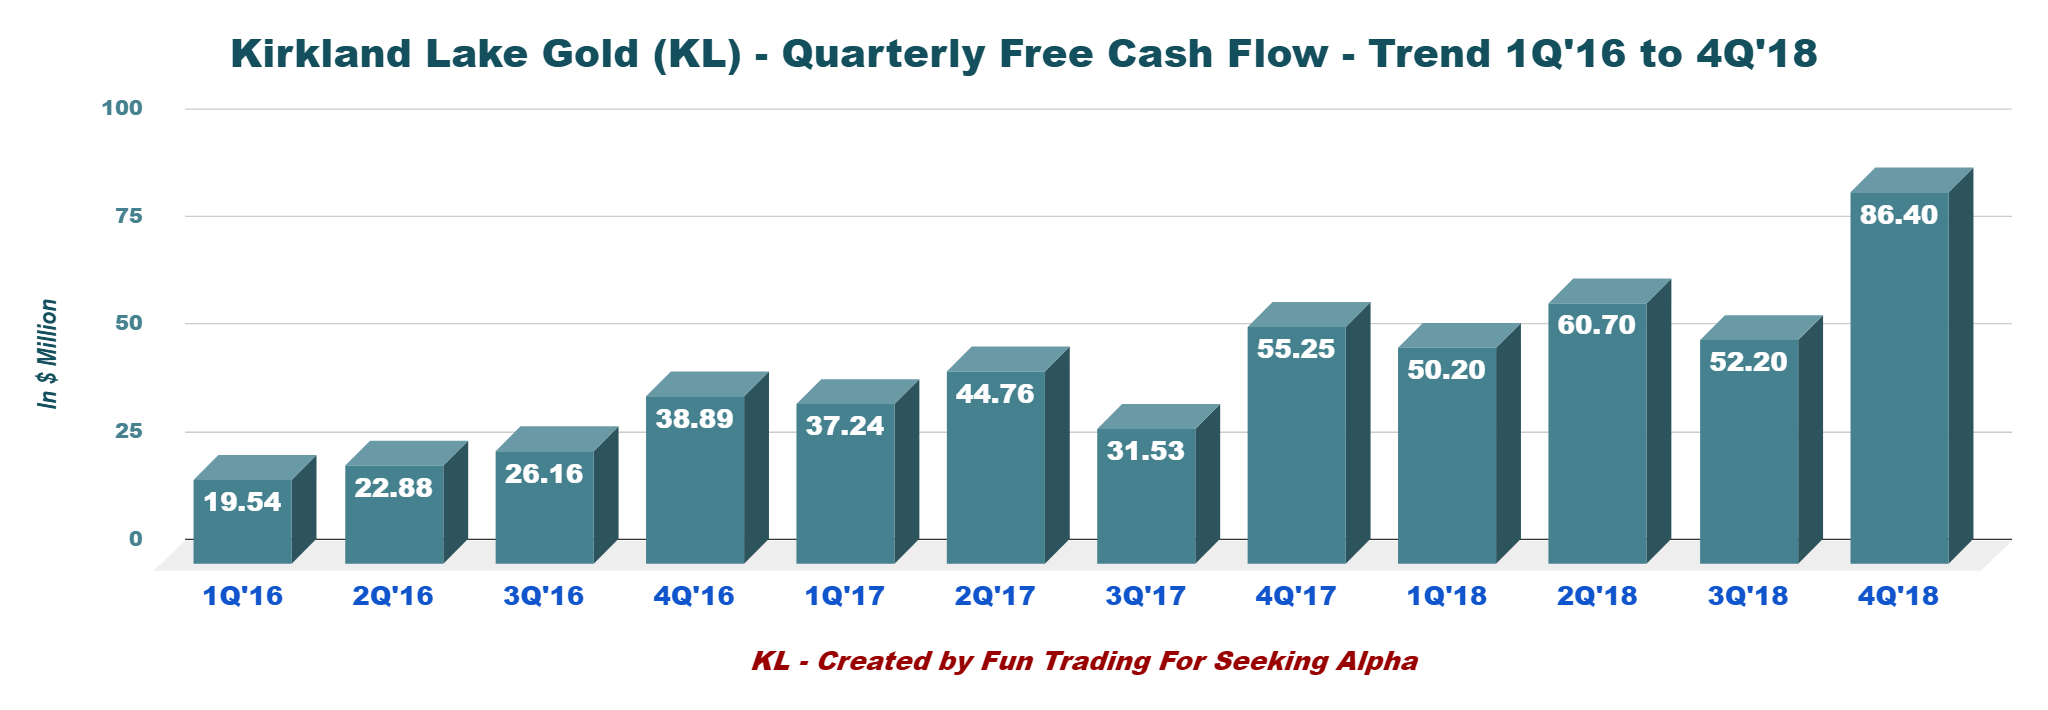 Free Cash Flow is a critical component for a gold miner, and I always include it in my analysis. You must generate free cash flow regularly if your mining business is viable.
Free Cash Flow provides the company with cash to buy back its shares, investment in other entities and pay a dividend. We calculate Free cash flow by subtracting CapEx to cash from operating activities.
For Kirkland Lake Gold the fourth quarter of 2018 indicates an FCF of $86.4 million and free cash flow for the year 2018 is $249.5 million. FCF is showing the strength of the company which was able to:
Invest in public entities that totaled 66.1 million (e.g., Novo, Osisko Mining). Realize a Buyback of 30.8 million common shares. And pay a dividend of $16.3 million during the year 2018.3 - Available capital, no net debt, and ample liquidity
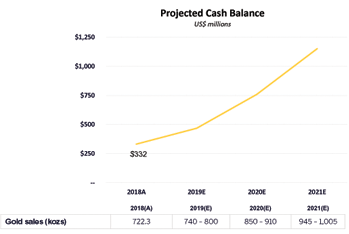
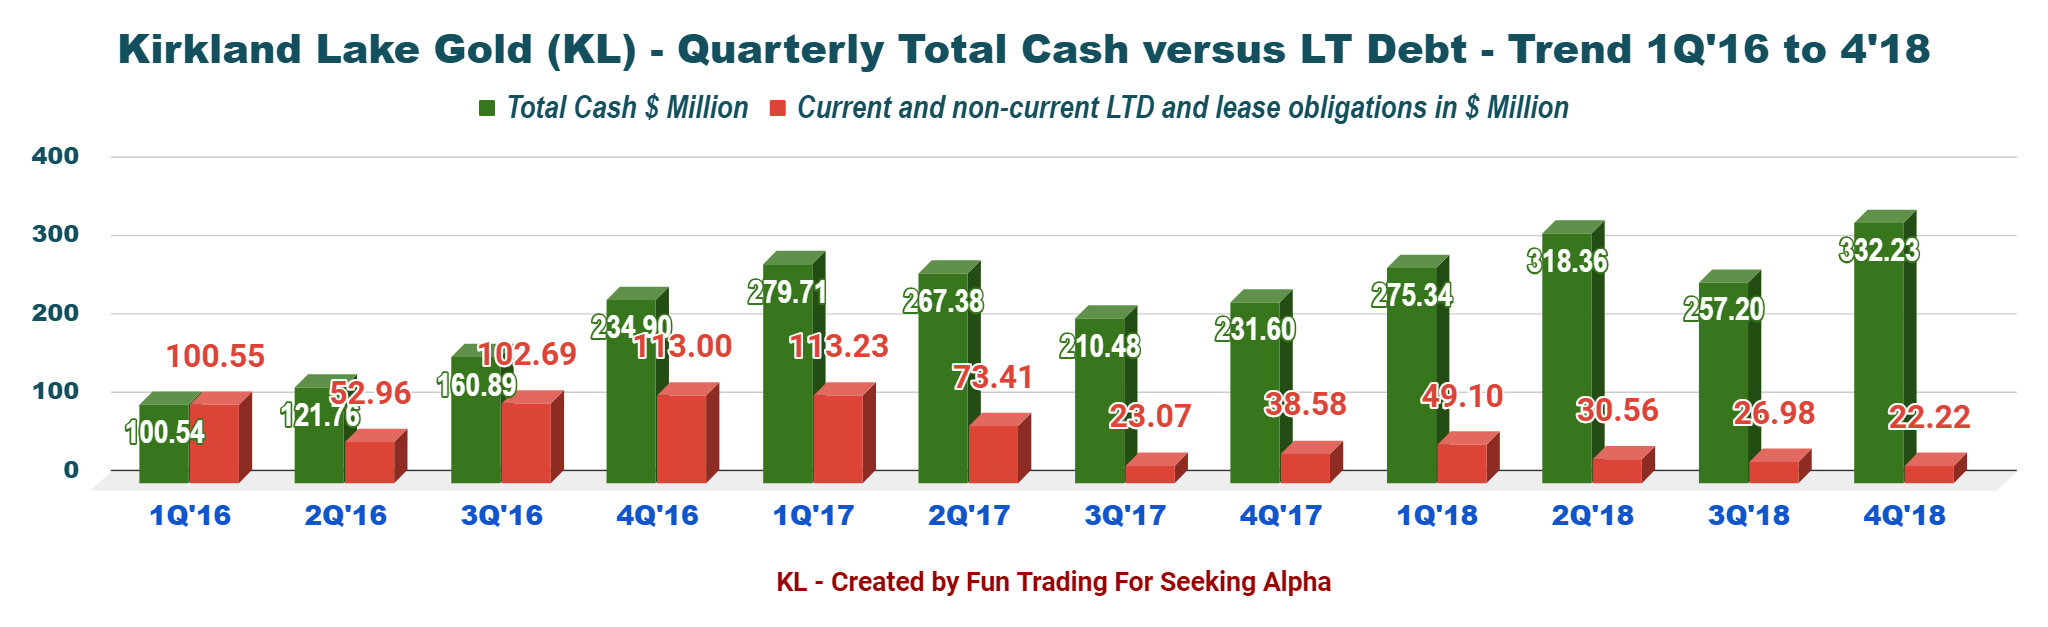 The best is yet to come for Kirkland Lake Gold. According to the company's projected cash balance, Kirkland Lake is expected to reach well over $1 billion in cash by 2021.
Projected balance is expected to reach about $1.2 billion by 2021.
Source: KL Presentation
4 - Production in gold equivalent ounce and details
Gold production is quickly rising to a new record high and the last quarter was very impressive. A quick look back in time is supporting such aggressive growth which is about to continue until 2021 with a production expected at above 1 M Oz.
The two following graphs are quite interesting because if you look at both of them, you can get a good idea of what makes Kirkland Lake Gold so exceptional and places the company ahead of the pack.
All-in sustaining costs or AISC, in short, is impressive with $567 per ounce this quarter. We will have to imagine how such performance can influence revenues assuming gold price well above $1,300 per ounce.
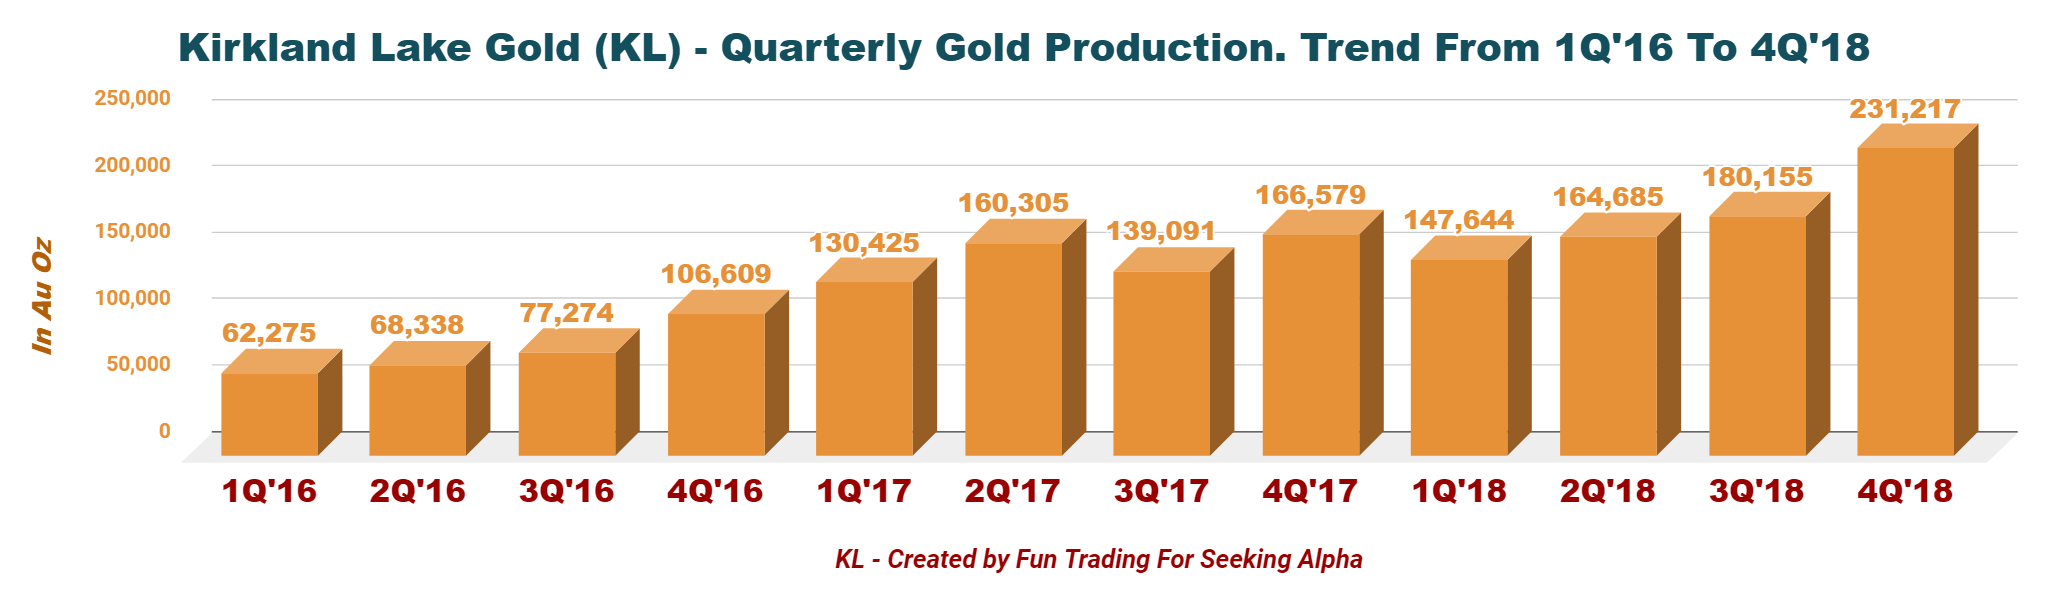
As we can see below, Macassa and Fosterville mines are the two main gold producers and represent 84% of the total output for 4Q'18.
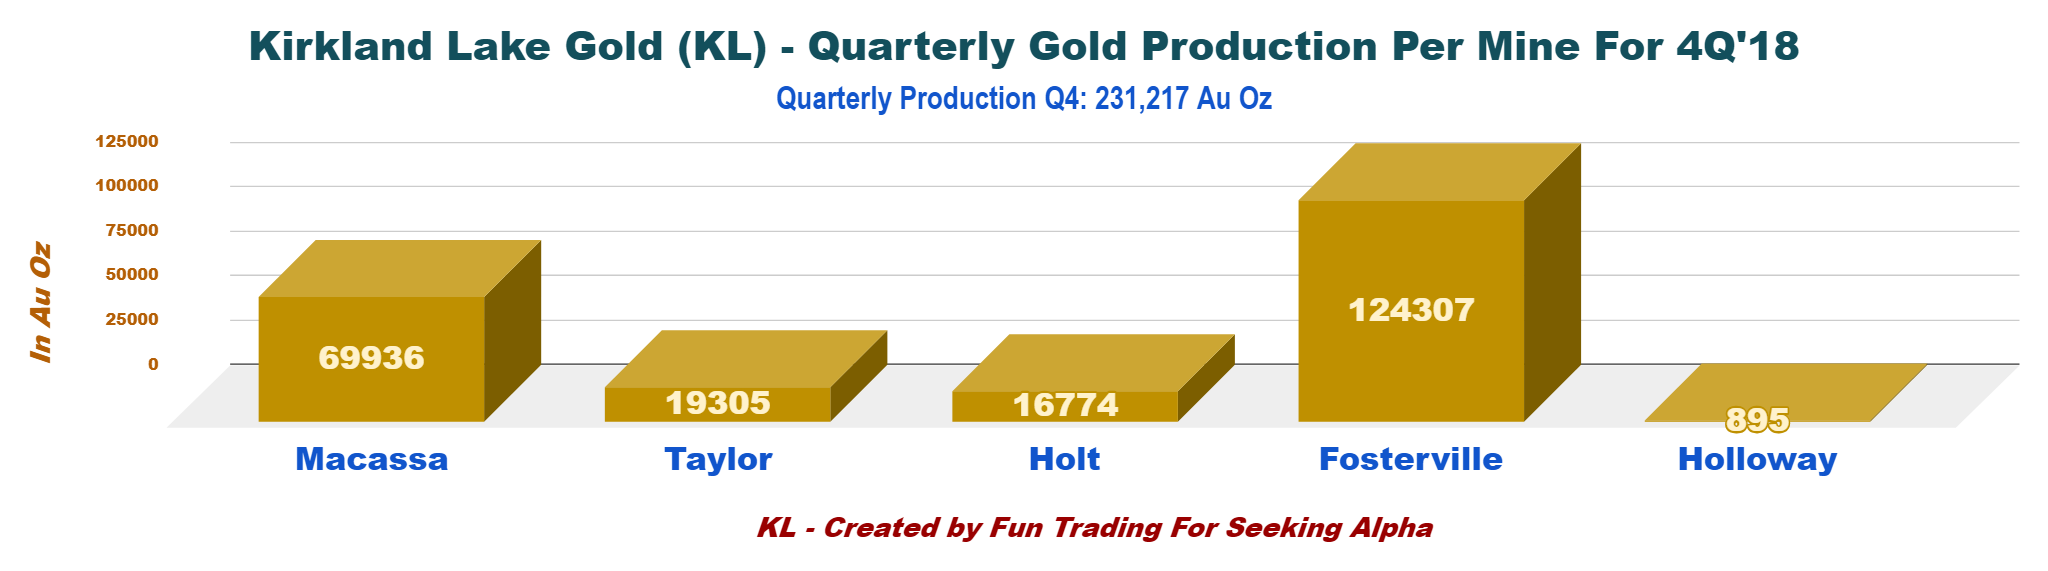 Kirkland Lake Gold had record gold production results in both Fosterville and Macassa.
The grade for the company in the quarter was 17.8 grams per tonne or its highest the level ever with cash costs of $286 an ounce and all-in sustaining costs of $567 an ounce.
Fosterville mine is a "cash cow" with an exceptional grade and potential of growth staggering with more exploration coming.
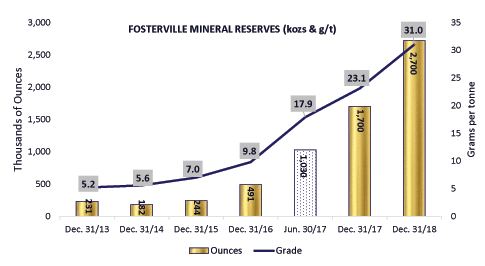
Source: KL Presentation
5 - Guidance 2019
As I said earlier, the best is yet to come, and the following chart is indicating the three-year guidance is explaining why. The recent forecast shows an increase in production of 32.7% in 2019 compared to 2018.
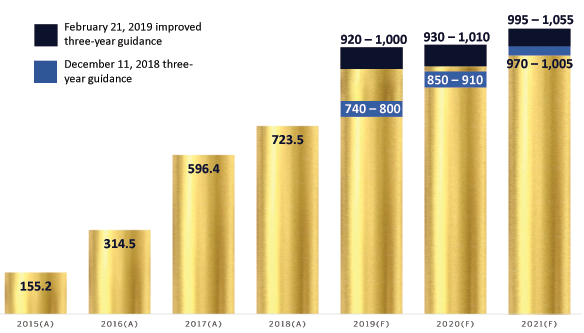
Source: KL Presentation
The Company announced on February 22, 2019, new and improved production goals:
2019: Improved to 920k-1 M ounces from 740k-800k ounces initially. 2020: Improved to 930k-.01 M ounces from 850k-910k ounces 2021: Improved to 995k-1.055 M ounces from 970k-1.005 M ounces.Conclusion And Technical Analysis
I like Kirkland Lake Gold mainly because the company owns two outstanding mines that guarantee a steady success at least for the next three years.
When you look at Fosterville and Macassa mines and the potential for the next few years, it is so manifest that it is not even worthwhile for me to reenter deeper the details and rehash what I have said above. The company is delivering on all requirements expected from a perfect long-term gold investment with low risk of failure.
Moreover, the management led by Tony Makuch is "down to earth," orderly and very inspiring.
The only task remaining now is to implement a trading/investing strategy to maximize your gain while preparing for the right market situation.
Yes, of course, a few components of this puzzle will never be known and will have to be considered carefully. Price of gold is an important variable, but technical hiccups are also in my mind. Mining is not an easy-walk-in-the-park type of business, and we must always be aware of a potential failure.
The only question remaining is the "how to."
We know by now that we should accumulate such a good miner for the long term, but it is imperative, in my opinion, to trade the short-term fluctuation as well. The recent high range $34.50-$36.00 was a good example. Thus, using about 30% of your position is highly recommended. Taking profit on the way up will allow you to accumulate on any meaningful retracement and safely average up.
Technical Analysis
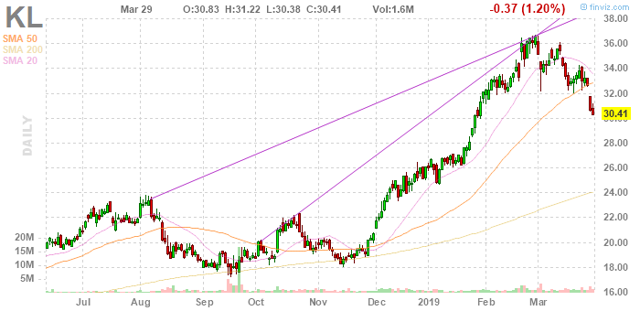
KL reached a strong resistance at $36 in early March and retraced over 15% now. The question now is to know what to expect for the short term.
My interpretation is that the stock is now forming an ascending channel pattern with line resistance at $38.50 (which is my 2019 top target) and line support at about $28 (I recommend accumulating at this level).
Ascending channel patterns are considered bullish short term, which means that we are experiencing a temporary retracement and the stock price should resume its positive trend, depending on the future gold price.
Author's note: If you find value in this article and would like to encourage such continued efforts, please click the "Like" button below as a vote of support. Thanks!
Disclosure: I/we have no positions in any stocks mentioned, but may initiate a long position in KL over the next 72 hours. I wrote this article myself, and it expresses my own opinions. I am not receiving compensation for it (other than from Seeking Alpha). I have no business relationship with any company whose stock is mentioned in this article.
Follow Fun Trading and get email alerts