Kirkland Lake Gold Is Firing On All Cylinders
Kirkland Lake Gold just finished a phenomenal year production-, exploration- and financial-wise - and was the top performing stock on the TSX in 2017.
However, Kirkland is on the verge of an incremental jump in production and cash flow late this year with the stoping of the Fosterville's Swan zone.
Kirkland is on its way to realizing a free cash flow yield in the low-teens in 2019.
Kirkland could generate almost 50% of 2019 free cash flow generated by Barrick, Newmont and Goldcorp - despite being only 20%-35% of their size.
Editor's note: Seeking Alpha is proud to welcome David Monus as a new contributor. It's easy to become a Seeking Alpha contributor and earn money for your best investment ideas. Active contributors also get free access to the SA PRO archive. Click here to find out more >>
Kirkland Lake Gold Limited (KL) (KLG.TO) (KLA.AX) is about to enter a transformative period over the next 12-18 months as it brings on stream its recent extremely high-grade discoveries at its Fosterville mine. The stock appears to be very attractively priced, especially based on production and cash flow projections for early 2019 provided in this analysis.
Kirkland Lake Gold is a Canadian-based mid-tier gold mining company with all its operating mines and properties located in the mining-friendly jurisdictions of Canada and Australia. It was formed by the amalgamation in 2016 of Kirkland Lake Gold with both St. Andrew Goldfields Ltd. and Newmarket Gold, Inc. It produced 596,000 ounces of gold in 2017 with operating cash costs of $481/oz and an AISC of $812/oz. It finished 2017 debt-free and had a net cash balance of $232 million.
It is an understatement that Kirkland Lake Gold has been firing on all cylinders since its amalgamation with Newmarket Gold in late 2016. All measures of financial and operational performance strongly support this opinion: reserve growth, production growth, operating efficiency improvements, cash flow growth, earnings growth - you name it. Each of these factors hit record levels and exceeded guidance, which, by the way, was revised upward no less than three times last year.
This smooth-running engine permitted management to make many shareholder-friendly financial-related decisions during 2017. These include implementation of its first-ever share repurchase program, initiating its first-ever dividend (and then doubling the dividend payment amount six months later), the buyback of one series of preferred shares for $44 million (and the conversion of the other preferred share series outstanding), leaving Kirkland debt-free at year end, and making a $78 million strategic investment in Novo Resources (a wide-area unique conglomerate speculative gold play in the Pilbara region of North West Australia). The best part is that all these actions were paid with free cash flow generated during the year.
Of course, Kirkland's performance did not go unnoticed by investors - with Kirkland getting the recognition it deserved for a job well done - it was the top performing stock traded on the TSX in 2017 returning nearly 175%. This is all good, but it represents history and investors are focused on tomorrow and the next day - and not so much on yesterday. The important question for today is: Can this level of performance be maintained going forward, or, better yet, can this car run even faster?
This report attempts to answer this all-important question by starting with Kirkland's 2018 guidance released on Feb. 21, 2018, and then quantifying the incremental impact the Swan zone will have on Kirkland's consolidated operational and financial results at year-end 2018 annualized rates. The three critical assumptions in this analysis are:
Total Fosterville mill feed rate is 650,000 tpa. Swan zone represents 25% of total Fosterville mill feed (assuming Swan zone stoping starts in the summer of 2018, and is running steady-state by Q1-2019). At steady-state, the Swan zone mill feed ore will be at the current reserve grade of 61.2 gpt.This analysis does not attempt to modify Kirkland's 2018 annual guidance per se - although if this analysis is correct, then undoubtedly their guidance will turn out to be conservative. This analysis concludes that this vehicle called Kirkland Lake Gold can run much faster than expected - especially when entering 2019 and beyond.
2018 Guidance
Table 1 is Kirkland's 2018 Guidance presented at its year-end 2017 webcast on Feb. 21, 2018. Most of the guidance figures are unremarkable and represent essentially just an annualized continuation of late 2017 actual performance except for the 2018 gold production estimate of +620,000 ounces. Given the company has only minor seasonal aspects to its operations, it is somewhat perplexing that their Q4-2017 actual production translates to just over 666,000 ounces at an annualized rate - and the company is forecasting lower gold production in 2018. Could there be some "sandbagging" going on here?
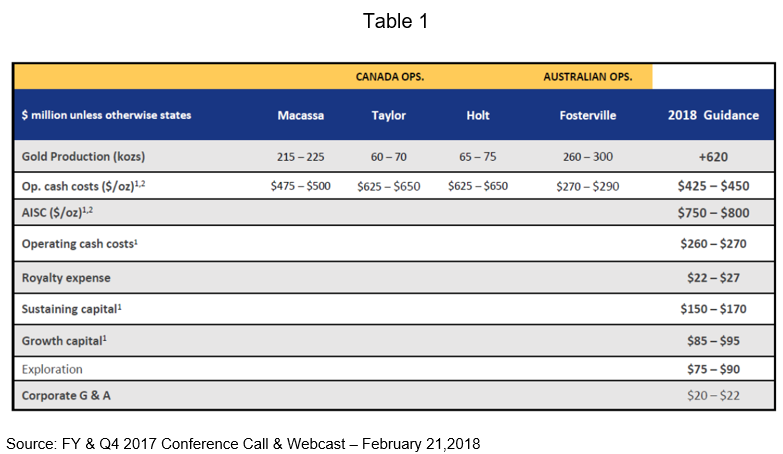
2018 gold production plan volumes for Macassa, Taylor, and Holt mines respectively appear reasonable given recent production and reserve grades and should come in at plan or slightly higher - however, the Fosterville estimate begs for some closer examination.
2017 Exploration Successes
Recently announced reserves and resources estimates indicate that Kirkland's 2017 exploration program was not only very productive but also productive across all their mines - both operating and non-operating. These results are summarized for the Fosterville and Macassa mines in Table 2.
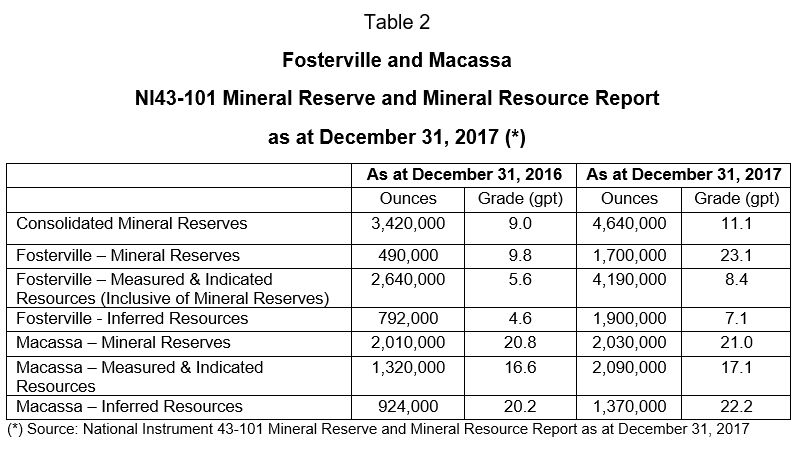
As Table 2 indicates, consolidated reserves increased 36% in 2017 with an accompanying increase in the consolidated reserve grade from 9.0 gpt to 11.1 gpt. Reserve tonnes increased and grade increased - a great combination!
Kirkland has an embarrassment of riches when it comes to its two main operating mines - Fosterville and Macassa. These two mines, with reserve grades of 23.1 gpt and 21.0 gpt respectively are true global standouts in terms of reserve grade. One could spend a lot of time trying to find another company with not two but even one reserve deposit of this grade anywhere else in the world. This is 'real' high grade.
Fosterville Mine
The main driver of future reserve and production growth is the heavy-lifting done by Fosterville - with reserves increasing by a whopping 1,210,00 ounces or 247% on a year over year basis. Reserve tonnes were up - and the reserve grade increased from 9.8 gpt to 23.1 gpt. However, one must look even deeper into Fosterville to see the real exploration moonshot: the "Swan."
This "Swan" Appears Ready to Lay Many, Many Golden Eggs
The Swan zone was discovered slightly more than one year ago as a downward extension of the Phoenix decline. The initial drilling results were so impressive that Kirkland promptly decided to commission a mid-year NI 43-101 reserve update - which is highly extraordinary. A summary of the updated reserve results for the Swan zone is provided in Table 3. It becomes apparent why the decision to undertake a mid-year reserve update was done.
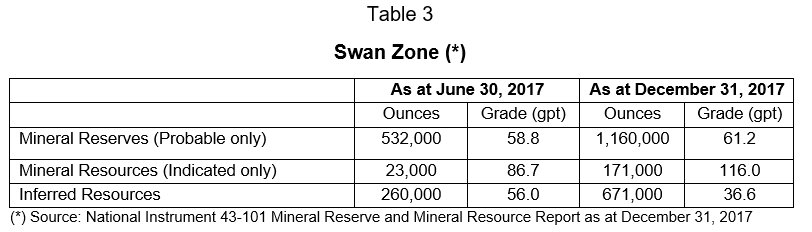
Several points need to be emphasized regarding these Swan zone reserve and resource figures:
There were no reserve or resource ounces as at Dec. 31, 2016, so these results represent one year's worth of maiden exploration The reserve grade at December 31, 2017 is 61.2 gpt (that's correct: 1.95 ounces per tonne) Second, the indicated mineral resource is at 116.0 gpt (that is also correct: 3.73 ounces per tonne)As if these grades were not impressive enough, the company, in response to questions raised during the Q&A portion of the year-end 2017 webcast held on Feb. 21, 2018, regarding the Swan zone exploration activities, stated:
(Qualitatively) that about 500 meters of drilling (that had occurred since the December 31, 2017 cut-off date for the NI43-101 report) downdip of the Swan reserve envelope displayed increasing grade with depth. The Swan exploration priority for 2018 was infill drilling via the plan to reduce the drilling grid to 25 meters by 25 meters (compared to the existing 50 meters by 50 meters spacing) with the specific goal of up-grading current indicated resource ounces to reserve ounces.Fosterville/Swan: Assay Top Cuts
In Fosterville's prior years' reserve estimates, the independent engineers used a 75 gpt top cut (aka "top cut") for assays associated with disseminated sulfides like those at Fosterville. This is a prudent and conservative approach and serves to limit the impact that even a small number of high-grade intercepts can have on the final reserve and resource estimates.
Table 4 shows the number composites (assays) in the data set with grades above each respective cut-off grade.
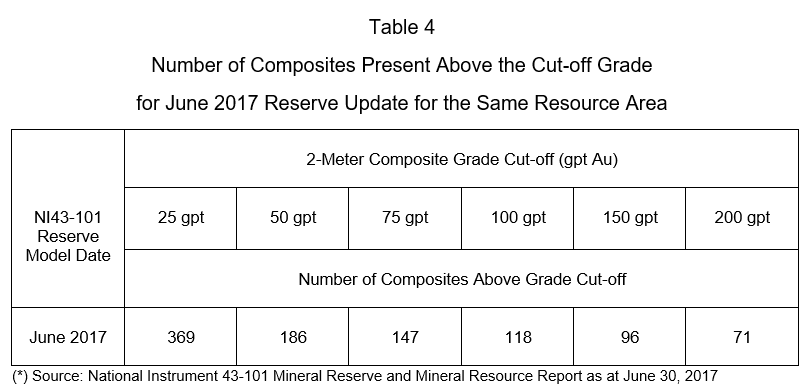
Note that the independent engineer's reserve calculation methodology for the June 30, 2017, Swan zone reserve update capped 147 assays that contained intercepts grading above 75 gpt. It is not entirely clear as to exactly how many Swan zone assays were used in the mid-year reserve update but given the number of meters drilled and the decision to use 1.5-2.0 meter composite lengths, it is reasonable to assume that the total number of assays in the dataset was in the 400-500 range. So, a rough estimate, is that about 20-25 percent of the assays submitted were capped in the reserve update calculation.
The four most important takeaways regarding the Swan zone reserve update are; current reserve grade of 68.8 gpt, current indicated resources grade of 116.0 gpt, current top-cut grade of 75 gpt (with approximately 25% of total assays exceeding this grade), and the comment made by management during the Feb. 21, 2018, webcast Q&A session that "grade generally increases with depth" along strike downdip of the current Swan zone reserve.
In combination, these four points strongly suggest that future Swan zone reserve updates should increase the reserve grade beyond the current 61.2 gpt level. Could the Swan zone reserve grade exceed the two-ounce per tonne level in the next year? It appears that this is not only possible but now probable. One must wonder if Kirkland will do another reserve update in mid-2018 for the Swan! A further increase in Swan zone reserve grade will surely turbo-charge this car named Kirkland Lake Gold. It will be interesting to see what the reconciliation grades look like after the company has been mining the Swan zone during the last half of this year.
Fosterville Mill: Capacity, Recovery Level, Cash Operating Cost
The Fosterville mill commenced operation in 2005 and has a nameplate/rated capacity of 830,000 tpa (2,275 tpd) and was operated by Newmarket Gold at feed rates approaching 740,000 tpa in 2016. The mill process involves BIOX, CIL and gravity circuits. Gold recovery has steadily increased over the past three years and was 96.3% in Q4-2017 (which is excellent for a BIOX facility).
In April 2016, Newmarket Gold installed a gravity separator (Knelson concentrator) at the front end of the Fosterville mill to accommodate increasing volumes of coarse gold in the feed at the time. In retrospect, this $5 million capital expenditure was very insightful since Kirkland currently realizes about 25% gold recovery with the Knelson concentrator.
Even better, Kirkland stated during the February 2018 webcast that they are currently installing additional gravity separation capacity at Fosterville and expect gold recoveries to be in the 50% range when the Swan and new Harrier zones are being mined steady state. It will be interesting to see the magnitude of the additional reduction in Fosterville's already very low planned 2018 cash operating cost of US$270-290/oz that will occur when the new mine feeds are processed.
The company also said during the February 2018 webcast that it needs to expand its Fosterville refinery this year. It appears that the current back-end of the mill will choke on the amount of gold being produced. What a great "problem" to have - lack of capacity to pour dore! No capital cost estimate was provided for the refinery during the webcast, but it will be minimal.
Numbers Time
It is now time to take this Swan zone-related information and provide a reasonable estimate of Kirkland's production volumes, cash flow, and free cash flow at year-end 2018 (on an annualized basis). It is assumed that the Swan zone will be running steady state at year-end 2018/early 2019.
Fosterville Gold Production
Estimating Fosterville's annualized gold production rate as at year-end 2018 is dependent on three main factors: mill feed grade, mill feed volume, and mill recovery rate. These are estimated as follows:
1) Mill feed grade estimate basis:
Management has guided that for planning purposes, the Swan zone is expected to provide about 25% of total mill feed at steady state Non-Swan zone ore grade: Assumed to be at 2017's weighted-average Fosterville feed grade of 16.7 gpt. (Note that Fosterville's Q4-2017 actual mill feed grade was 21.5 gpt and Q1-2018's was 20.4 gpt, but that management recently guided that they do not expect to continue 2017's high grade stoping strategy in 2018. Also note that Fosterville's reserve grade as at December 31, 2017 is 23.1 gpt.) Swan zone feed grade: Assumed to be the current Swan zone reserve grade of 61.2 gptBased on these three assumptions, the average Fosterville mill feed grade is:
0.25 X 61.2 + 0.75 X 16.7 = 27.8 gpt (or 0.88 opt)
2) Mill ore throughput volume: Assume 650,000 tpa (Q1-2018 550,000 tpa, prior operator hit 740,000 tpa in 2016, and nameplate capacity of 830,000 tpa)
3) Mill recovery: 96.3% (Q4-2017 actual)
Of course, readers can choose the year-end 2018 mill feed rate they feel is most probable, but the remainder of this analysis assumes a 650,000 tpa rate. This feed rate was selected since it means that non-Swan zone portion of the Fosterville feed volume remains at the Q4-2017 actual rate of 475,000 tpa. Since this volume represents 75% of total mill feed, as per management's recent guidance, the Swan zone feed volume is therefore 158,333 tpa. Combining these two results in a total Fosterville mill feed rate of 633,000 tpa (rounded to 650,000 tpa).
Table 5 provides the estimated annualized Fosterville gold production rates for throughput rates varying from 475,000 tpa to 830,000 tpa.
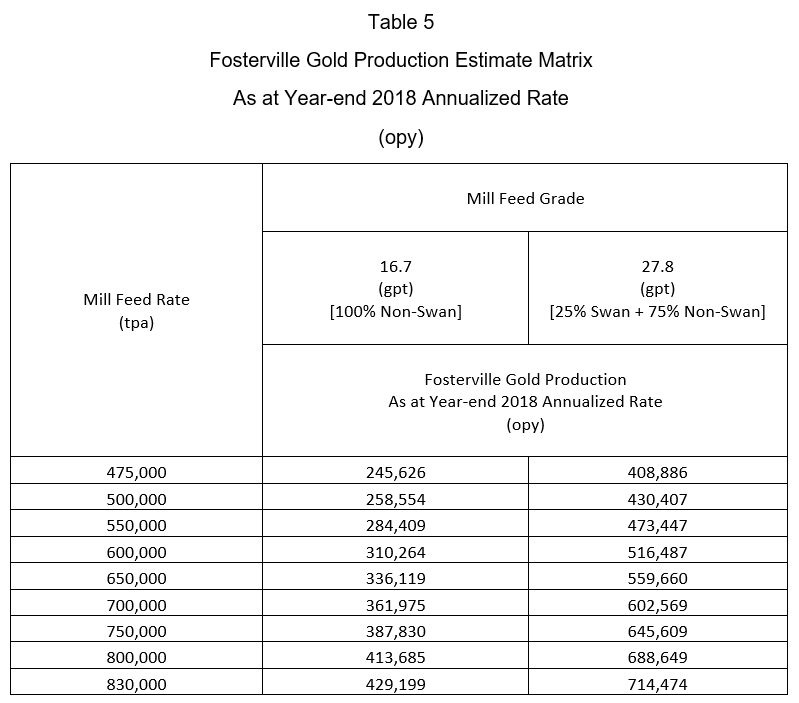
For reference, the middle column of Table 5 represents the case where the Fosterville mill ore feed is entirely from the existing (non-Swan) stopes at a feed grade equal to 2017's weighted average grade of 16.7 gpt.
The right-hand column of Table 5 provides Fosterville's gold production volume for the combined 25/75 feed mix. For the 650,000 tpa assumption used in this analysis, a total yield of 559,600 opy would be expected on an annualized basis (rounded to 560,000 opy).
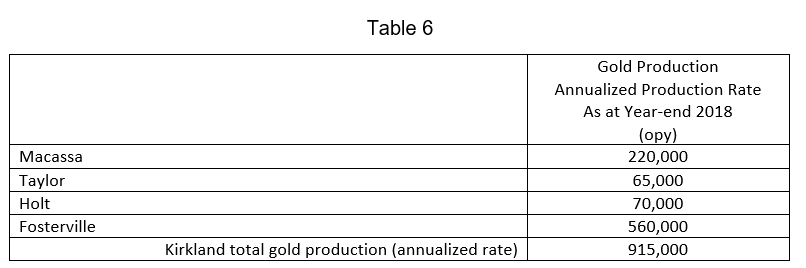
Assuming Macassa, Holt and Taylor mines 2018 year-end production rate equals their respective 2018 planned annual production rate, then Kirkland's total gold production running rate as at year-end 2018 is provided in Table 6.
Operating Cash Flow Estimate
Cash Operating Cost Estimate
To calculate Kirkland's total corporate operating cash flow at year-end 2018 running rate it is necessary to adjust Kirkland's 2018 cash operating cost guidance to reflect the incremental additional gold production attributable to Swan zone production.
For reference, Table 7 provides the 2018 plan production and cash cost guidance (extracted from Table 1).

Table 8 provides a similar depiction but shows the total corporate year-end 2018 annualized gold production and cash operating cost estimate assuming the 25/75 mill feed mix. Note that the reduction in total corporate cash operating cost from $450/oz to $395/oz is entirely attributable to the increased proportion of Fosterville production on a total corporate basis.
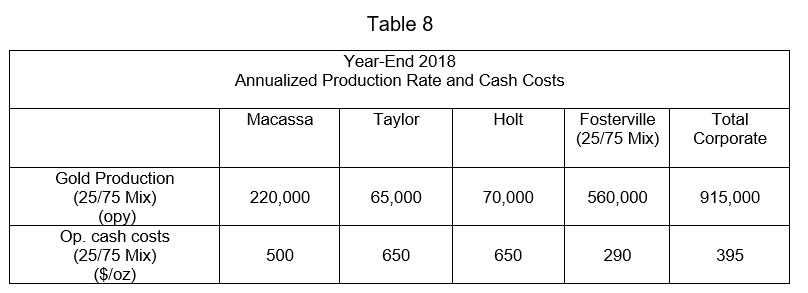
It should also be noted that the $290/oz cash operating cost guidance provided by management and used in this analysis is likely to be proved conservative since management guided that the installation of additional gravity/centrifuge recovery capacity this year will nearly double the gravity recovery proportion to almost 50%. This will materially reduce the current cash operating cost guidance due to cost savings associated with bypassing the CIL and BIOX mill process train steps with this incremental gravity recovery step.
All in Sustaining Cost (AISC) Estimate
The next step is to estimate its AISC. Table 9 provides details of Kirkland's estimated AISC calculation as at year-end 2018.
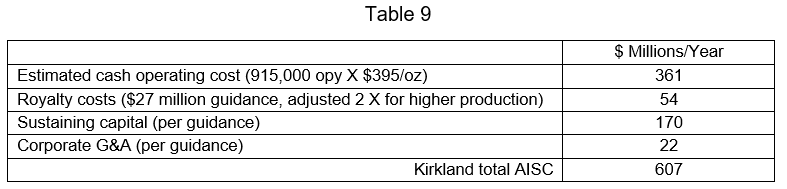
So, the estimated AISC at year-end 2018 annualized rate is calculated as follows:
$607 million/915,000 ozs = $663/oz
This compares to the 2018 AISC guidance range of $750/oz - $800/oz.
Operating Cash Flow Estimate
With an assumed gold bullion market price of $1,350/oz, the total corporate operating cash flow and operating cash flow per share at year end 2018 annualized rates respectively is calculated as follows:
915,000 ozs/year X ($1,350/oz - $663/oz) = $629 million/year
Therefore, the operating cash flow per fully-diluted share is:
$629 million/210 million shares = $2.99/share
Kirkland's Relative Valuation
One of the two most popular fundamental valuation metrics for precious metals producers is the 1-year forward P/CF (or EV/EBITDA), along with P/NAV.
With Kirkland's current market capitalization of approximately $3.6 billion (or C$4.6 billion) it straddles somewhere between a mid-cap producer and a large-cap producer. Table 10 provides the current P/CF multiples for two peer groups based on market capitalization.
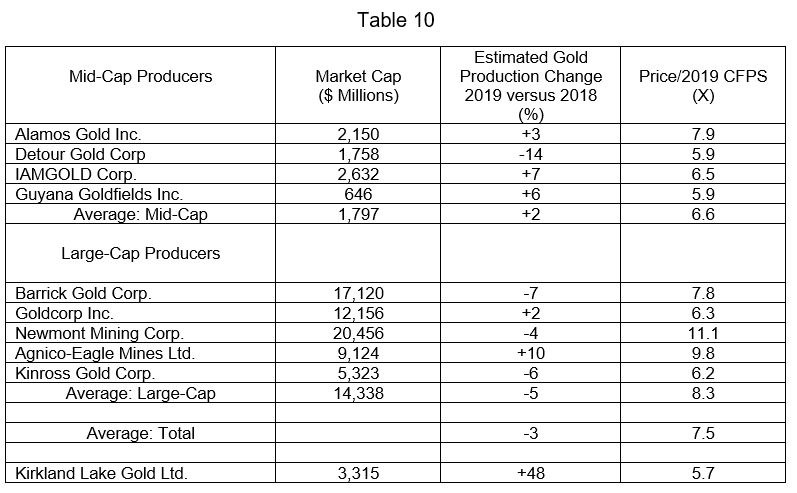
As Table 10 indicates, the estimated gold production growth from 2018 to 2019 is an abysmal +2 percent on average for the mid-cap peer group, and a decline of 5 percent on average for the large-cap group. It is clear that five years of cumulative under-investment in exploration has started to take a toll on the production growth rate for the average large-cap gold producer.
On a P/2019 CFPS multiple basis, Kirkland, currently trading at 5.7 X, sits between the average for the mid-cap peer group and the large-cap group, so its appears reasonably valued.
However, this conclusion changes drastically when a comparison is done between P/2019 CFPS and the expected production growth rate from 2018 to 2019. Here it is very clear that the market is not ascribing appropriate value for Kirkland's dramatic increase in production, at +48%. (Note that Kirkland's production growth rate is calculated based on it's 2018 guidance of 620,000 oz. vs. the 915,000 oz 2018 exit rate arising from this analysis.) This comparison is conservative since it is based on gold production volume growth alone and does not include any credit for the reasonable expectation that it's cash flow margin will also increase year-over-year since it's operating costs will decline with it's drastic production volume increase.
Free Cash Flow (FCF) Estimate
This is where Kirkland absolutely shines financially. Ultimately, the true measure of a company's managerial capabilities is it's ability to consistently generate an elevated level of FCF relative to its competitors.
Combining the operating cash flow estimate, and Kirkland's guidance for growth capital and exploration capital yields Kirkland's estimated FCF amount at year-end 2018 on an annualized basis. Table 11 provides this calculation.
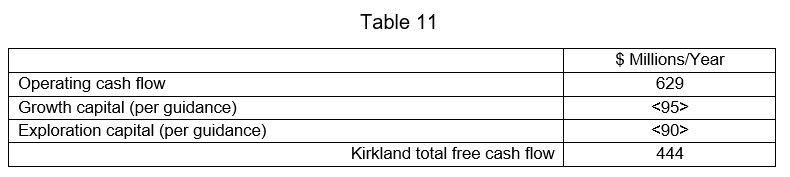
Under this analysis, Kirkland is expected to generate $444 million of FCF ($2.11/share) in 2019 assuming it produces all next year at its 915,000 opy 2018 exit rate.
Table 12 provides the FCF amount and corresponding FCF yield estimates for a mid-cap gold producer peer group and a large-cap gold producer group, for the years 2018 and 2019 respectively. FCF yield is defined as the annual free cash flow generated in a year divided by the current market value of the company.
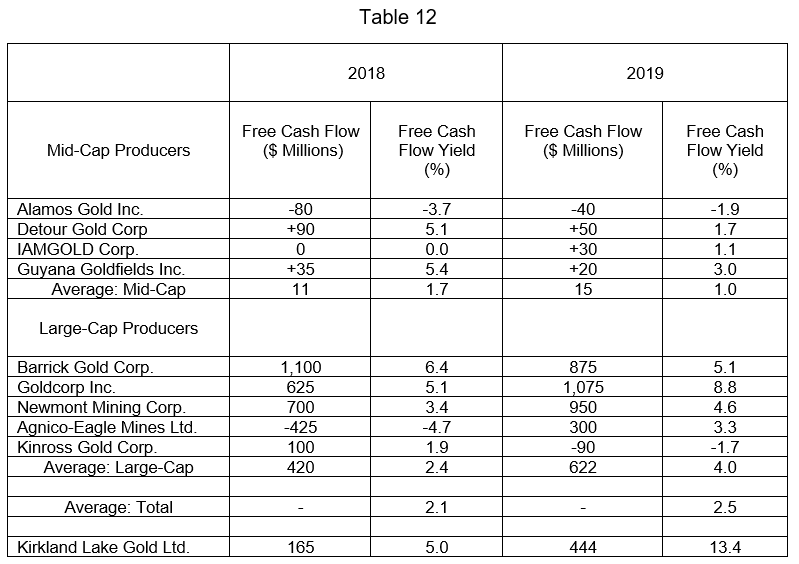
Kirkland compares favorably to both capitalization groups on almost all measures of FCF generation.
In terms of 2018 FCF yield, Kirkland's, estimated at 5.0%, is more than twice the average FCF yield for both the mid-cap and the large-cap groups. However, in 2019, this spread becomes more profound, where at an estimated 13.4%, Kirkland's FCF yield is more than 13 times its mid-cap peer group FCF yield and almost 3.5 times its large-cap peer group FCF yield!
In terms of the amount of FCF generated, Kirkland is expected to generate about $444 million of FCF in 2019. This amount is equal to almost 50% of the amount of the FCF generated by Barrick Gold Corp. (ABX), Goldcorp Inc. (GG) and Newmont Mining Corp. (NEM) even though Kirkland's estimated 2019 gold production is only 21%, 37%, and 19% of the 2019 production for each of these three large-cap producers respectively!
To put this amount of FCF in perspective, at its current market price, Kirkland could repurchase more than 12% of its outstanding stock. Alternatively, it could pay a dividend of more than $2.11/share. It will be interesting to see what Kirkland does with its FCF over the next couple of years.
Graph 1 depicts the FCF yield (%) versus the amount of FCF ($) generated in 2019 for each of the companies included in this analysis, respectively.

The best-fit line clearly indicates the positive correlation between FCF yield and the amount of FCF generated - which is primarily attributable to economies of scale. It is apparent that Kirkland has superior FCF generating capabilities relative to its size.
Kirkland's Valuation
Returning to operating cash flow multiples, this analysis estimates that Kirkland will enter 2019 with operating cash flow generation rate of $629 million/year which equates to $3.00/share.
Based on various estimated P/2019 CFPS multiples, Kirkland's potential market price is provided in Table 13.
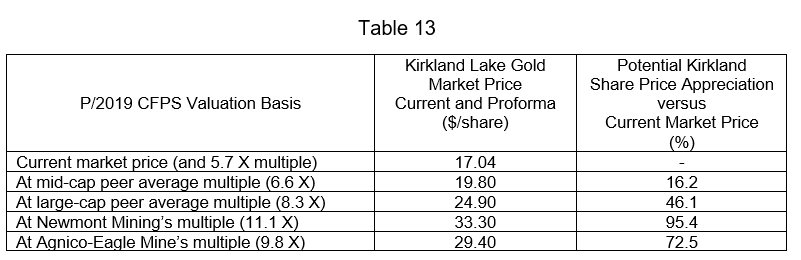
One can argue that some of these P/2019 CFPS valuations seem high, the following factors for Kirkland should also be taken into consideration:
It does not incorporate any additional value for the rather exceptional free cash flow generation capabilities of Kirkland compared to its peer group and large-cap group. It does not consider that Kirkland is debt-free. It assumes that no shares are repurchased during the year. It does not consider that Kirkland has recently shown some compelling exploration results and is continuing to aggressively explore in the Northern Territory where its goal is to re-start the Cosmo mine (which is currently in a "re-start ready" status). The Cosmo mine re-start is dependent on the Lantern deposit proving-up five-years' worth of reserves (approximately 400,000-500,000 ounces). Also, regarding Kirkland's Northern Territory assets, it should be remembered that the Maud Creek PEA (dated May 18, 2016) concluded the following: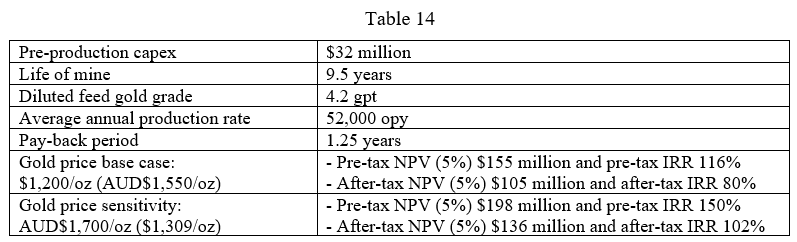 The potential restart of the Cosmo mine combined with the decision to develop the Maud Creek deposit utilizing the idled Union Reefs Mill would add an incremental 150,000 opy of annual production by mid-late 2019.
Conclusion
Despite phenomenal exploration, production, financial, and stock market success over the past one-and-a-half years, Kirkland is on the verge of an incremental increase in very low-cost production from its Fosterville operation (Swan zone in particular). The magnitude of this production bump, and its associated low cost structure, should become apparent by year-end 2018 assuming Swan zone stoping starts later this summer.
Those focused in investing in highly profitable, debt-free, gold mining companies with rapidly growing reserves and production in two of the world's most attractive mining jurisdictions - Australia and Canada - should consider adding Kirkland Lake Gold to their portfolio.
Disclosure: I am/we are long KL.
I wrote this article myself, and it expresses my own opinions. I am not receiving compensation for it (other than from Seeking Alpha). I have no business relationship with any company whose stock is mentioned in this article.
Follow David Monus and get email alerts