Long Term Gold / US Dollar Cycles Show Big Trends For Metals / Commodities / Gold & Silver 2020

In the first part of our US$ and Gold research, we highlighted the US Dollar vs. Gold trends and how we believe precious metals have recently bottomed while the US Dollar may be starting a broad decline. We are highlighting this because many of our friends and followers have asked us to put some research out related to the US Dollar decline. Back in November, we published an article that highlighted the Appreciation/Depreciation phases of the market. This past research article – How To Spot The End Of An Excess Phase – Part II – is an excellent review item for today’s Part II conclusion to our current article.
Custom Metals Index Channels & Trends
Our Weekly Custom Metals Index chart, below, highlights the major bottom in precious metals in late 2015 as well as the continued upside price rally that is taking place in precious metals. If our research is correct, the bottom that formed in 2015 was a “half cycle bottom” – where the major cycle dates span from 2010 to 2019 or so. This half-cycle bottom suggests risk factors related to the global market and massive credit expansion after the 2008-09 credit crisis may have sparked an early appreciation phase in precious metals – launching precious metals higher nearly 3 to 4 years before the traditional cycle phases would normally end/reverse.
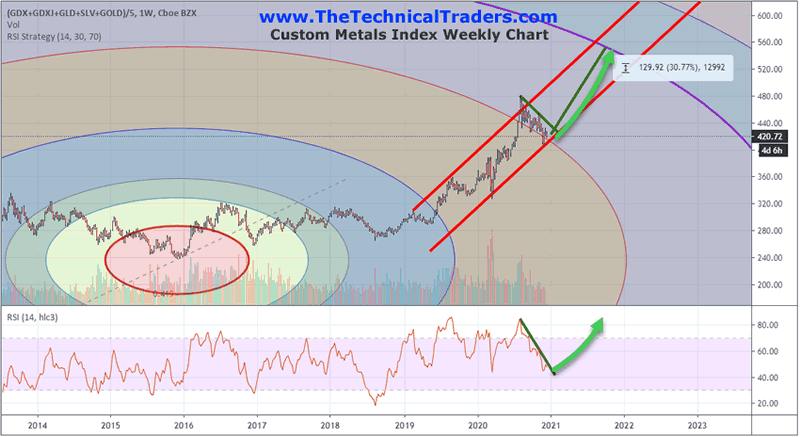
Recently, the upside price trend on this Custom Metals index page suggests a price channel has setup and may continue. The recent pullback in price has just recently touched the lower price channel and started to stall near these lows. If precious metals prices resume any upward price trends after reaching these lows, the technical pattern will stay valid and we believe Gold will attempt to rally above $2350 to $2500 in this next leg higher. Longer-term, we feel it us just a matter of time before precious metals begin another breakout rally.
Longer-term Cycle Phases – Why They Are Important
Lastly, we want to leave you with the following longer-term market cycle chart showing the US Dollar, the SPX500 and GOLD. We know this chart is a bit complicated and cluttered, but we’ll try to highlight the key elements for you to understand. First, look for the rallies and declines in the US Dollar Index in alignment with the “Appreciation” and “Depreciation” phases. Remember, the left and right edges of this chart are in a “Depreciation” phase thus, the dramatic selloff in the US Dollar index on the left edge of this chart took place near the beginning of a Depreciation Phase. The rally in the US Dollar Index from 1992 to 2000 took place in an Appreciation Phase. Currently, we believe we have ended an Appreciation Phase and started a new Depreciation phase in the markets.
Be sure to sign up for our free market trend analysis and signals now so you don’t miss our next special report!
Now, take a look at the SPX500 line on this chart. Notice how bigger rallies take place in Appreciation phases and sideways trending (with massive volatility) take place in Depreciation phases? The last Appreciation Phase started in 2010~11 (or so) and ended in 2018~19 (or so). If our research is correct, this new Depreciation phase will last until 2027~28 (or so) and may prompt a very big volatility cycle in the US Dollar and the US/Global stock markets.
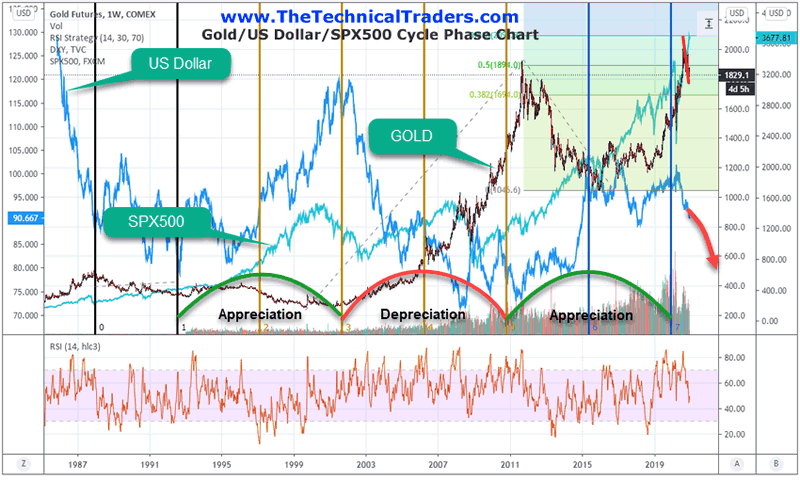
Now, pay attention to how Gold setup a major bottom in late 2015 (mid-cycle phase). Could this be an indication that precious metals reacted to the peak in the US Dollar index rally phase early 2015 and subsequent peak in the US Dollar in December 2016 (remember, that date was just after a major US election)? Could the early phase rally in precious metals be warning us that another 600%+ rally in precious metals (just like what happened from 2000 to 2011) take place from the 2015 Gold lows near $1080? If so, does this mean the ultimate upside price target for Gold is some where above $6,800?
If our research is correct, the longer term rotations in the global markets aligned with these major market phases will mean traders will have to learn to identify and trade the best performing assets at all times. The shifts in how assets and sectors are valued will continue to roll in and out of favor as capital moves from one sector to another. Precious metals and the US Dollar are just one component of the broader markets – there are hundreds of sector ETFs and thousands of individual stock symbols to select from. Skilled traders need to know when sectors perform the best and which asset classes/symbols are poised for the best returns – that is the only way to really try to beat the markets over the next 9+ years.
Precious metals should continue to find support and attempt to rally higher if our longer-term research is accurate, but skilled technical traders know we can’t simply rely on precious metals over the next 8+ years – we need more diversity and we need to protect our trading capital from losses. The only way to do that is to learn how to spot the best performing assets and to stay ahead of emerging trends. Get ready, the next few years are certainly going to be interesting and full of opportunities.
We publish this free research to help you stay ahead of broad market trends and to illustrate how we apply our technical analysis skills in helping you find and trade the best performing assets. We are proud of the research we deliver to you fro FREE, but if you want to profit from our knowledge then go to www.TheTechnicalTraders.com to learn more about our BAN trading and review an example of my daily pre-market reports. Please take a minute to visit our web site to see how we can help you survive and prosper from these big future trends.
Chris Vermeulen
www.TheTechnicalTraders.com
Chris Vermeulen has been involvedin the markets since 1997 and is the founder of Technical Traders Ltd. He is an internationally recognized technical analyst, trader,and is the author of the book: 7 Steps to Win With Logic
Through years ofresearch, trading and helping individual traders around the world. He learnedthat many traders have great trading ideas, but they lack one thing, theystruggle to execute trades in a systematic way for consistent results. Chrishelps educate traders with a three-hourvideo course that can change your trading results for the better.
His mission is to help hisclients boost their trading performance while reducing market exposure andportfolio volatility.
He is a regularspeaker on HoweStreet.com, and the FinancialSurvivorNetwork radio shows. Chriswas also featured on the cover of AmalgaTrader Magazine, and contributesarticles to several leading financial hubs like MarketOracle.co.uk
Disclaimer: Nothing in this report should be construed as a solicitation to buy or sell any securities mentioned. Technical Traders Ltd., its owners and the author of this report are not registered broker-dealers or financial advisors. Before investing in any securities, you should consult with your financial advisor and a registered broker-dealer. Never make an investment based solely on what you read in an online or printed report, including this report, especially if the investment involves a small, thinly-traded company that isn’t well known. Technical Traders Ltd. and the author of this report has been paid by Cardiff Energy Corp. In addition, the author owns shares of Cardiff Energy Corp. and would also benefit from volume and price appreciation of its stock. The information provided here within should not be construed as a financial analysis but rather as an advertisement. The author’s views and opinions regarding the companies featured in reports are his own views and are based on information that he has researched independently and has received, which the author assumes to be reliable. Technical Traders Ltd. and the author of this report do not guarantee the accuracy, completeness, or usefulness of any content of this report, nor its fitness for any particular purpose. Lastly, the author does not guarantee that any of the companies mentioned in the reports will perform as expected, and any comparisons made to other companies may not be valid or come into effect.
Chris Vermeulen Archive |
© 2005-2019 http://www.MarketOracle.co.uk - The Market Oracle is a FREE Daily Financial Markets Analysis & Forecasting online publication.