Long-term Potential for Gold Remains Strong! / Commodities / Gold & Silver 2019
 Technical analysis update forthe SPDR Gold Shares ETF (GLD).Long-term bullish continuationanticipated once current correction is completed.Looks like a deeper retracementmay come in the near-term, before resumption of the rally.
Long-term breakout
Following the August 2018 swing low of $111.06, GLDrallied 32.2% to the September 2019 high of $146.82. That rally foundresistance in the area of Fibonacci confluence, including the 50% retracementof the full downtrend measured off the 2011 peak, which was at $143.04. Notethat the 14-week Relative Strength Index (RSI) was quite overbought at thatpoint (83.52), the most overbought since the extreme 2011 peak (83.87).
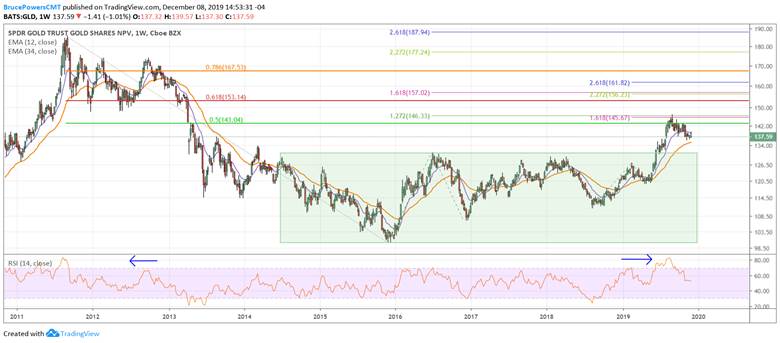
GLD WeeklyChart – long-term
A bullish crossover of the 10-week exponential movingaverage (ema) and the 34-week ema occurred at the beginning of 2019. Mostimportantly, the rally took GLD out of a bottoming pattern to a 71-month high.Once $131.15 (July 2016 swing high) was broken to the upside price advanced tothe September 2019 high with conviction, as there was barely a pullback of anysignificance.
Normal retracement to date
As is normal in financial markets, once a breakout ofsignificance occurs (multi-year breakout off bottom in this case), price willretrace some degree of the advance towards the breakout area. The degree ofretracement will vary and may provide some insight into the characteristics ofthe trend pattern. Following the retracement, a resumption of the initial trendcan be expected unless shown otherwise.
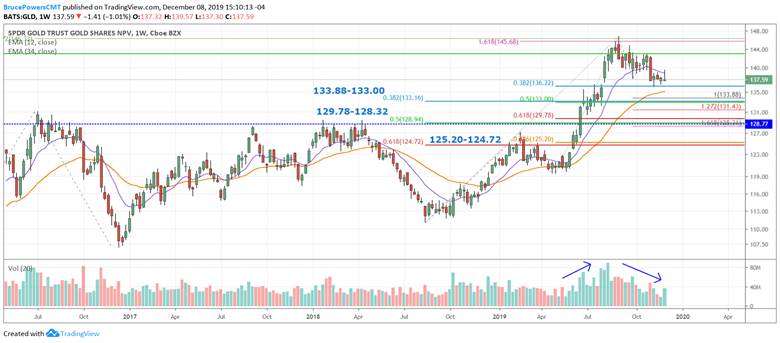
GLD WeeklyChart – near-term
To date, the retracement has reached $136.19, therebycompleting a minimum Fibonacci retracement of 38.2% (at $136.40). Volume hasbeen falling as price declines. Note that price has fallen below and closedbelow the 10-week ema (blue line) for the past five weeks and tested it asresistance for the past four. This is a sign of short-term weakness and pointsto further selling pressure unless something changes (such as daily close abovelast week’s $139.57 high).
Multiple lowerpossible support zones
If price does continue to fall, then watch the nextthree potential support zones for subsequent signs of a bullish reversal:
Each price zone is derived from multiple Fibonacciretracement and projection levels, as well as prior price pivot levels.
Bruce Powers, CMT
Chief Technical Analyst
http://www.marketstoday.net/
© 2019 Copyright Bruce Powers- All Rights Reserved
Disclaimer: The above is a matter of opinion provided for general information purposes only and is not intended as investment advice. Information and analysis above are derived from sources and utilising methods believed to be reliable, but we cannot accept responsibility for any losses you may incur as a result of this analysis. Individuals should consult with their personal financial advisors.
© 2005-2019 http://www.MarketOracle.co.uk - The Market Oracle is a FREE Daily Financial Markets Analysis & Forecasting online publication.