Mining For Gold
Screened through gold producers and royalty companies narrowed down to Newcrest (NCMGF) and Newmont (NEM) for further research.
Both companies have better than average free cash flow yields and sustainable levels of debt.
Newcrest in particular has a low all-in sustainable cost of $720 per ounce.
This article follows up on a hunch about getting gold exposure I talked about for my portfolio. In my trade ideas section, I mentioned that I will be building on upstream gold companies and have started researching.
The ideal portfolio weight is in equity (and equity derivatives) to make up 40% of the portfolio and 20% is in REIT and bonds or bond-like instruments. 10% in gold and precious metals through producers or royalty-companies rather than outright positions. So now I am focusing on what to add in for my 10% allocation.
My hunch was initially on Barrick Gold (GOLD) and Wheaton Precious Metals (WPM), a miner and a royalty company. So I started there and found some interesting leads to dig deeper. So here we go.
Relative Valuations
| Ticker | Name | Est P/E Current Yr | Price/Book | EV/T12M EBITDA | FCF Yield (%) | P/Sales | P/Book |
| Median | Median | 21.93 | 1.67 | 10.52 | 1.5 | 2.28 | 1.67 |
| GOLD US Equity | BARRICK GOLD CORP | 37.25 | 2.02 | 11.41 | 2.31 | 3.26 | 2.02 |
| NEM US Equity | NEWMONT GOLDCORP CORP | 29.29 | 1.67 | 14.86 | 4.32 | 2.95 | 1.67 |
| AEM CN Equity | AGNICO EAGLE MINES LTD | 69.29 | 2.98 | 20.19 | -3.9 | 6.48 | 2.98 |
| K CN Equity | KINROSS GOLD CORP | 19.08 | 1.37 | 7.76 | -3.82 | 2.04 | 1.37 |
| YRI CN Equity | YAMANA GOLD INC | 43.54 | 0.82 | 5.89 | -0.3 | 1.84 | 0.82 |
| NCM AU Equity | NEWCREST MINING LTD | 21.27 | 2.45 | 11.52 | 4.81 | 4.98 | 2.45 |
| PLZL RM Equity | POLYUS PJSC | 11.15 | 14.78 | 9.47 | 4.49 | 4.83 | 14.78 |
| ANG SJ Equity | ANGLOGOLD ASHANTI LTD | 18.37 | 3.14 | 9.76 | 2.8 | 2.28 | 3.14 |
| GFI SJ Equity | GOLD FIELDS LTD | 21.93 | 1.66 | 5.4 | 0.01 | 1.71 | 1.66 |
| BUENAVC1 PE Equity | CIA DE MINAS BUENAVENTUR-COM | 27.15 | 1.29 | 23.28 | 1.5 | 3.93 | 1.29 |
| HAR SJ Equity | HARMONY GOLD MINING CO LTD | 9.19 | 1.16 | 5.65 | -1.35 | 0.94 | 1.16 |
| SGL SJ Equity | SIBANYE GOLD LTD | 23.4 | 1.92 | 10.52 | 10.5 | 0.95 | 1.92 |
| 2899 HK Equity | ZIJIN MINING GROUP CO LTD-H | 13.23 | 1.62 | 10.55 | -2.08 | 0.47 | 1.62 |
Source: Bloomberg, figures are accurate as at September 28, 2019.
From the table of miners above, what immediately catches the eye are Newmont (NEM), Newcrest (OTCPK:NCMGF) and Sibanye Gold (SBGL). Reasons being price-to-book being reasonable (under 2x) and free cash flow yield. Sibanye (SBGL) in particular caught my eye with a 10.5x EV/EBITDA multiple and a 10.5% free cash flow yield. Newcrest (OTCPK:NCMGF) looked to be trading slightly at a premium to the peer group average in terms of EV/EBITDA 11.5x and has a better free cash flow yield than the peers, at 4.8%. From a large miner perspective, it also seems like Newmont is a better choice than what I originally picked - Barrick Gold (GOLD) in terms of the valuation metrics above.
Next up from a balance sheet health and debt load perspective, the following table came up.
| Ticker | Name | Debt/EV | Net Debt/EBITDA | Tangible Book Value/Share | Long Term Debt/Total Assets | Quick Ratio | Current Ratio |
| Median | Median | 0.29 | 1.71 | 6.34 | 21.57 | 0.72 | 1.91 |
| GOLD US Equity | BARRICK GOLD CORP | 0.26 | 1.08 | 7.24 | 25.16 | 1.09 | 2.38 |
| NEM US Equity | NEWMONT GOLDCORP CORP | 0.20 | 1.95 | 21.05 | 16.50 | 2.07 | 2.95 |
| AEM CN Equity | AGNICO EAGLE MINES LTD | 0.16 | 2.09 | 17.88 | 21.92 | 0.88 | 2.97 |
| K CN Equity | KINROSS GOLD CORP | 0.32 | 1.43 | 3.63 | 21.52 | 0.58 | 2.61 |
| YRI CN Equity | YAMANA GOLD INC | 0.45 | 1.98 | 3.78 | 21.92 | 0.25 | 0.86 |
| NCM AU Equity | NEWCREST MINING LTD | 0.11 | 0.24 | 9.85 | 16.85 | 2.08 | 2.93 |
| PLZL RM Equity | POLYUS PJSC | 0.30 | 1.71 | 7.66 | 66.03 | 1.03 | 1.91 |
| ANG SJ Equity | ANGLOGOLD ASHANTI LTD | 0.29 | 1.60 | 6.34 | 28.77 | 0.46 | 1.55 |
| GFI SJ Equity | GOLD FIELDS LTD | 0.45 | 1.51 | 3.26 | 32.85 | 0.72 | 1.50 |
| BUENAVC1 PE Equity | CIA DE MINAS BUENAVENTUR-COM | 0.14 | 1.80 | 11.03 | 12.83 | 1.27 | 1.91 |
| HAR SJ Equity | HARMONY GOLD MINING CO LTD | 0.27 | #N/A N/A | 2.90 | 15.86 | 0.31 | 1.35 |
| SGL SJ Equity | SIBANYE GOLD LTD | 0.54 | 2.88 | 0.59 | 21.57 | 0.57 | 1.04 |
| 2899 HK Equity | ZIJIN MINING GROUP CO LTD-H | 0.46 | #N/A N/A | 0.22 | 19.31 | 0.32 | 0.82 |
Source: Bloomberg, figures are accurate as of September 28, 2019.
From the above, Sibanye Gold (SBGL) seems to have a considerable debt burden which is over half its enterprise value, and its quick ratio is also one of the lowest among the peers above. This probably explains the high free cash flow yield. So I won't be too hung up over this stock.
I am left to consider again Newmont and Newcrest. Newcrest in particular looks amazing from a balance sheet health perspective. With gold price potentially moving up, there is also headroom to expand its balance sheet through taking on more debt. Newmont too is pretty well capitalized and with debt just under 2x EBITDA, I reckon it is a healthy debt load to undertake on its books. Both have sufficient liquidity at 2x quick ratio. Nice!
Having screened the list of miners and narrowed down for a further research work on Newmont and Newcrest, I am moving on to royalty companies.
| Ticker | Name | Est P/E Current Yr | Price/Book | EV/T12M EBITDA | FCF Yield (%) | Enterprise Value | EV/EBITDA FY1(X) | P/Sales | P/Book |
| Median | Median | 54.71 | 3.81 | 25.30 | 1.16 | 8,532.30 | 23.24 | 19.81 | 3.81 |
| WPM US Equity | WHEATON PRECIOUS METALS CORP | 49.07 | NA | NA | NA | 13,253.74 | 24.71 | NA | NA |
| TNX CN Equity | TANZANIAN GOLD CORP | NA | 3.99 | NA | (3.96) | 124.16 | NA | NA | 3.99 |
| FNV CN Equity | FRANCO-NEVADA CORP | 59.38 | 3.69 | NA | NA | 17,581.05 | 27.67 | 26.41 | 3.69 |
| SSL CN Equity | SANDSTORM GOLD LTD | 100.39 | 1.89 | 22.52 | 1.16 | 1,067.54 | 18.36 | 14.37 | 1.89 |
| RGLD US Equity | ROYAL GOLD INC | 50.03 | 3.93 | 28.09 | 3.01 | 8,532.30 | 21.77 | 19.81 | 3.93 |
Source: Bloomberg, data accurate as at September 28, 2019.
When comparing the table above against the gold miners, there is nothing really to shout about in terms of royalty companies above from a free cash flow yield, EV/EBITDA and PE perspective.
However, these companies in general have a stronger balance sheet which probably accounts for the lower yields. Meaning they potentially provide more stability which I will dive deeper into (this is only a theory at this stage and I will be tracking the price charts against gold to see if the share price is equally sensitive to gold news as the miners are).
| Ticker | Name | Debt/EV | Debt/EBITDA | Tangible Book Value/Share | Long Term Debt/Total Assets | Quick Ratio | Current Ratio |
| Median | Median | 0.03 | 0.74 | 17.89 | 4.21 | 2.79 | 4.60 |
| WPM US Equity | WHEATON PRECIOUS METALS CORP | 0.13 | 2.27 | NA | 19.54 | 2.67 | 2.76 |
| TNX CN Equity | TANZANIAN GOLD CORP | 0.12 | (1.76) | NA | - | 0.03 | 0.10 |
| FNV CN Equity | FRANCO-NEVADA CORP | 0.02 | NA | NA | 4.21 | 2.79 | 7.14 |
| SSL CN Equity | SANDSTORM GOLD LTD | - | 0.78 | 3.13 | - | 3.98 | 5.36 |
| RGLD US Equity | ROYAL GOLD INC | 0.03 | 0.71 | 32.65 | 8.43 | 4.17 | 4.60 |
Source: Bloomberg, accurate as at September 28, 2019.
These royalty companies indeed have healthier balance sheets from the debt to enterprise value ratio and debt over EBITDA ratios. They also have good liquidity based on their quick ratios.
From this list above Royal Gold (RGLD) stands out as the better performer.
Prices tracking against gold
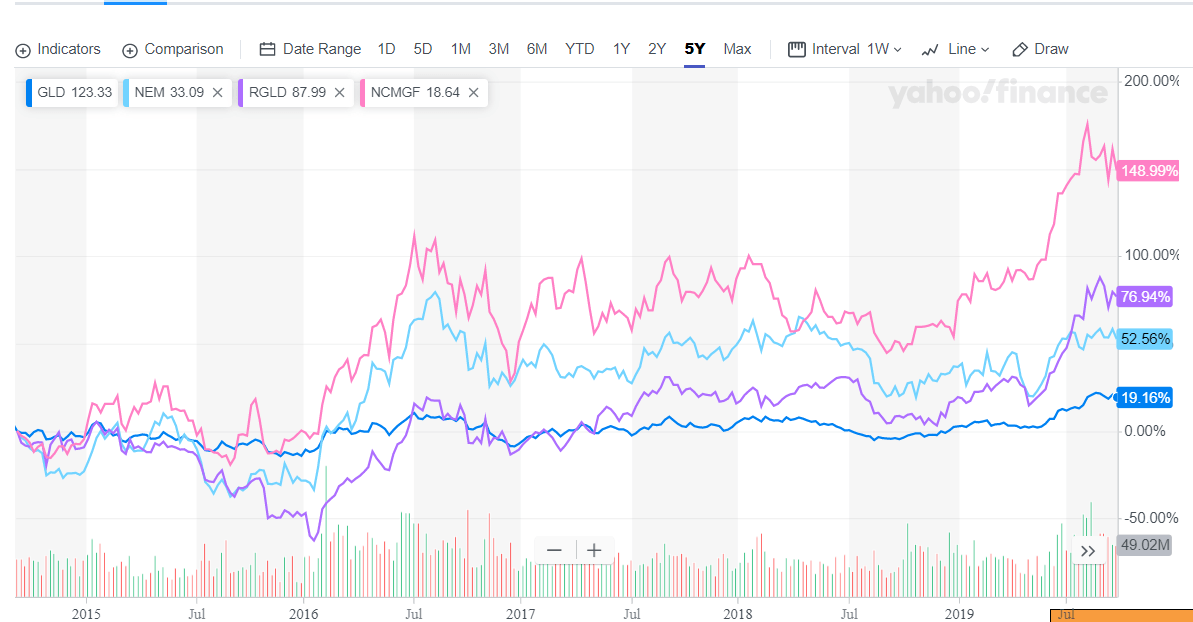
Source: Yahoo! Finance
The chart above compares returns of 4 tickers, SPDR Gold Shares (GLD) the gold ETF, Newmont, Royal Gold (RGLD) and Newcrest. Surprisingly the chart points out that the gold ETF seems the least volatile while Newcrest seems to be quite prone to price fluctuations. In general, the 3 stocks do share similar price trends.
Shortlisted stock for research
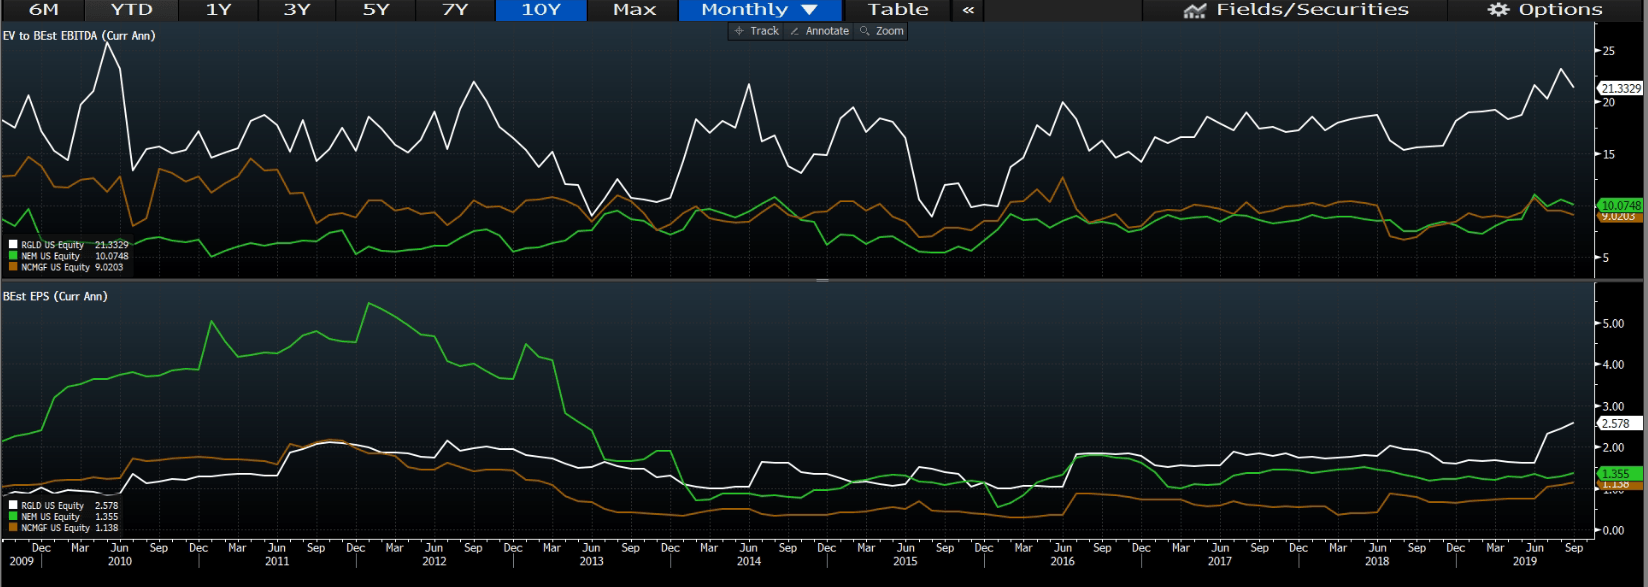
Source: Bloomberg
The above charts are Royal Gold, Newmont and Newcrest Enterprise Value to EBITDA followed by Earnings Per Share estimates of the three stocks over four quarters in the past ten years. What is striking is the stability of Earning Per Share of Royal Gold as compared to the mining companies Newmont and Newcrest. Newmont especially had declined substantially in terms of earnings in 2011 to 2013 but that has stabilized over the past 5 years.
While all three stocks are interesting, I am quite keen to follow up on the mining companies Newmont and Newcrest rather than royalties companies for now.
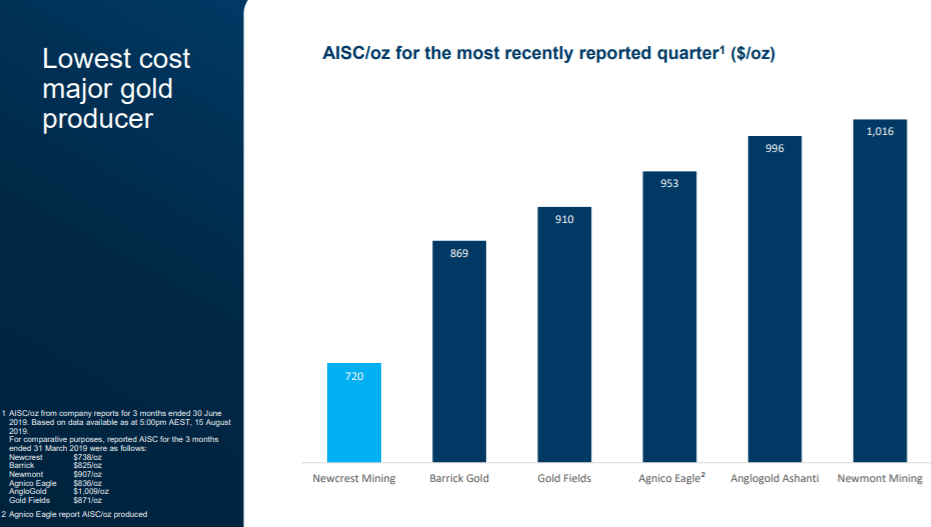
Source: Newcrest Corporate Presentation September 2019
The all-in sustaining cost of production for an ounce of gold is a reference point for breakeven levels based on latest production quarter ended June 30, 2019. Newcrest and Barrick Gold (GOLD) have the lowest out of the companies above.
Based on the information gathered so far, I'd like to prioritize research on Newcrest first, then Newmont.
For readers and investors who are familiar with these stocks or other gold companies, do drop me comments and views so I know if I am heading in the right direction or have missed out on critical factors in my evaluation. This is as much a learning process for me, so I am thankful for your feedback and views!
Disclosure: I/we have no positions in any stocks mentioned, and no plans to initiate any positions within the next 72 hours. I wrote this article myself, and it expresses my own opinions. I am not receiving compensation for it (other than from Seeking Alpha). I have no business relationship with any company whose stock is mentioned in this article.
Editor's Note: This article discusses one or more securities that do not trade on a major U.S. exchange. Please be aware of the risks associated with these stocks.
Follow Big Alpha Research and get email alerts