Natural Gas and Crude Oil - Diverging Setups For Technical Traders / Commodities / Natural Gas

 Over the past few weeks and months, we’ve been alerting our followers to the incredible setups in Natural Gas and Crude Oil. If you’ve been following our research, you already know on May 21st we called for Oil to break down from $62 level with a target of $55 then $49 price levels.
We’ve been alerting that Natural Gas was setting up an incredible seasonal trade with a move that was likely to push lower into the $2.00 to $2.20 level – suggesting any move into this range would be a solid buying opportunity for the seasonal upside move. Well, here we are about 35 days later and look at what happened.
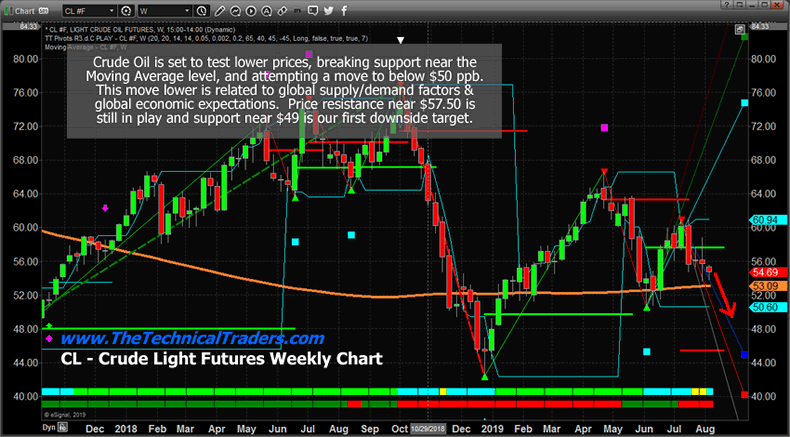
Crude Oil Weekly Chart
The US/China trade issues and global economic turmoil is taking a toll on Crude Oil. Price rotated downward very sharply last week with an incredible -8% downside move in one day. Currently, price is resting just above the Moving Average and should soon breakdown below this level towards the $49 price level. At that point, price should stall, briefly, before attempting to find support below $50.
Our Fibonacci price modeling system suggeststrue support is found near $45 and $40. Be prepared for a potential downside move of -20% to -25% from currentlevels.
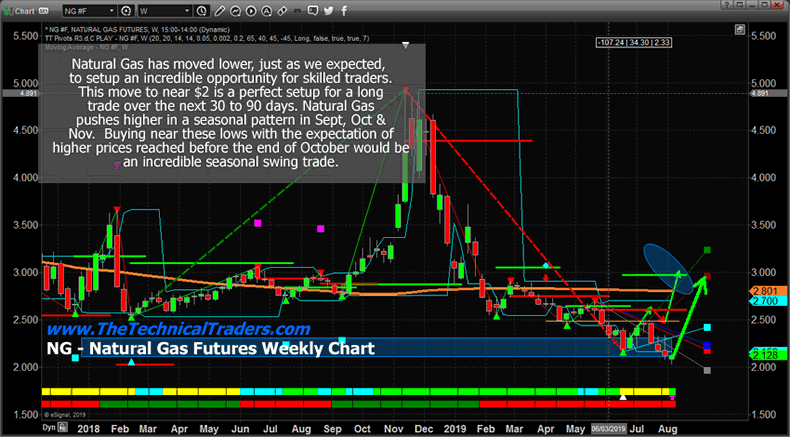
Natural Gas Weekly Chart
Natural Gas has done exactly what we expected. On this Weekly chart, you can see our shaded BLUE support range area and our GREEN and RED arrows from months ago highlighting what we expected to happen in price. Yes, price is lower than we currently expected, but it has aligned with our expected price rotation almost perfectly.
At this point, the sub $2.20 level is aperfect opportunity for skilled technical traders to prepare for the seasonaltrend that will push Natural Gas back above the $2.65 to $3.15 level. Allow us to go through our expectations withyou so you understand how to plan for and trade this move.
August is typically moderately bearish forNG. So expect to try to pick your entryfor this trade in August. The ratio ofbearish price activity in August is 1.2x the bullish price activity.
September is STRONGLY BULLISH – with anupside ratio of 10x compared to historical downside price activity. September is where we should see a big upsideprice move.
October is still STRONGLY BULLISH – with anupside ratio of 3x compared to historical downside price activity.
November is moderately bullish with a 1.3xupside ratio compared to downside price activity.
VIDEO – TODAYS MARKET ANALYSIS
SPX, BONDS, GOLD, OIL, NAT GAS
If you want to get access to my trading indicators and market prediction tools checkout these charts here
CONCLUDING THOUGHTS:
This means two things. First, Crude Oil should continue to breakdown and target the $49 price level over the next few days and weeks while Natural Gas sets up an incredible upside price setup below $2.25 for skilled technical traders. Oil is moving lower because of lower demand related to the global economic slowdown and larger supply issues. Natural Gas is setting up a seasonal pattern that could become a fantastic trading opportunity for traders that time their entries and understand the setup. In late August or early September price should begin to rally well above $2.50 with an ultimate upside target of well above $3.00.
In short, if you want to know what the market is going to nearly every day and get my trade alerts complete with entry, targets and stop prices join my Wealth Building Newsletter – www.TheTechnicalTraders.com
Chris Vermeulen
Technical Traders Ltd.
Chris Vermeulen
www.TheTechnicalTraders.com
Chris Vermeulen has been involvedin the markets since 1997 and is the founder of Technical Traders Ltd. He is an internationally recognized technical analyst, trader,and is the author of the book: 7 Steps to Win With Logic
Through years ofresearch, trading and helping individual traders around the world. He learnedthat many traders have great trading ideas, but they lack one thing, theystruggle to execute trades in a systematic way for consistent results. Chrishelps educate traders with a three-hourvideo course that can change your trading results for the better.
His mission is to help hisclients boost their trading performance while reducing market exposure andportfolio volatility.
He is a regularspeaker on HoweStreet.com, and the FinancialSurvivorNetwork radio shows. Chriswas also featured on the cover of AmalgaTrader Magazine, and contributesarticles to several leading financial hubs like MarketOracle.co.uk
Disclaimer: Nothing in this report should be construed as a solicitation to buy or sell any securities mentioned. Technical Traders Ltd., its owners and the author of this report are not registered broker-dealers or financial advisors. Before investing in any securities, you should consult with your financial advisor and a registered broker-dealer. Never make an investment based solely on what you read in an online or printed report, including this report, especially if the investment involves a small, thinly-traded company that isn’t well known. Technical Traders Ltd. and the author of this report has been paid by Cardiff Energy Corp. In addition, the author owns shares of Cardiff Energy Corp. and would also benefit from volume and price appreciation of its stock. The information provided here within should not be construed as a financial analysis but rather as an advertisement. The author’s views and opinions regarding the companies featured in reports are his own views and are based on information that he has researched independently and has received, which the author assumes to be reliable. Technical Traders Ltd. and the author of this report do not guarantee the accuracy, completeness, or usefulness of any content of this report, nor its fitness for any particular purpose. Lastly, the author does not guarantee that any of the companies mentioned in the reports will perform as expected, and any comparisons made to other companies may not be valid or come into effect.
Chris Vermeulen Archive |
© 2005-2019 http://www.MarketOracle.co.uk - The Market Oracle is a FREE Daily Financial Markets Analysis & Forecasting online publication.