Positive Action in the Gold Complex
- Rambus
Over the last few weeks or so I've been writing a lot on the critical inflection point the PM complex was showing us. Today's price action is an important step in confirming the potential bullish outcome. There is still more work to be done from a longer term perspective but its one step at a time until total confirmation is attained.
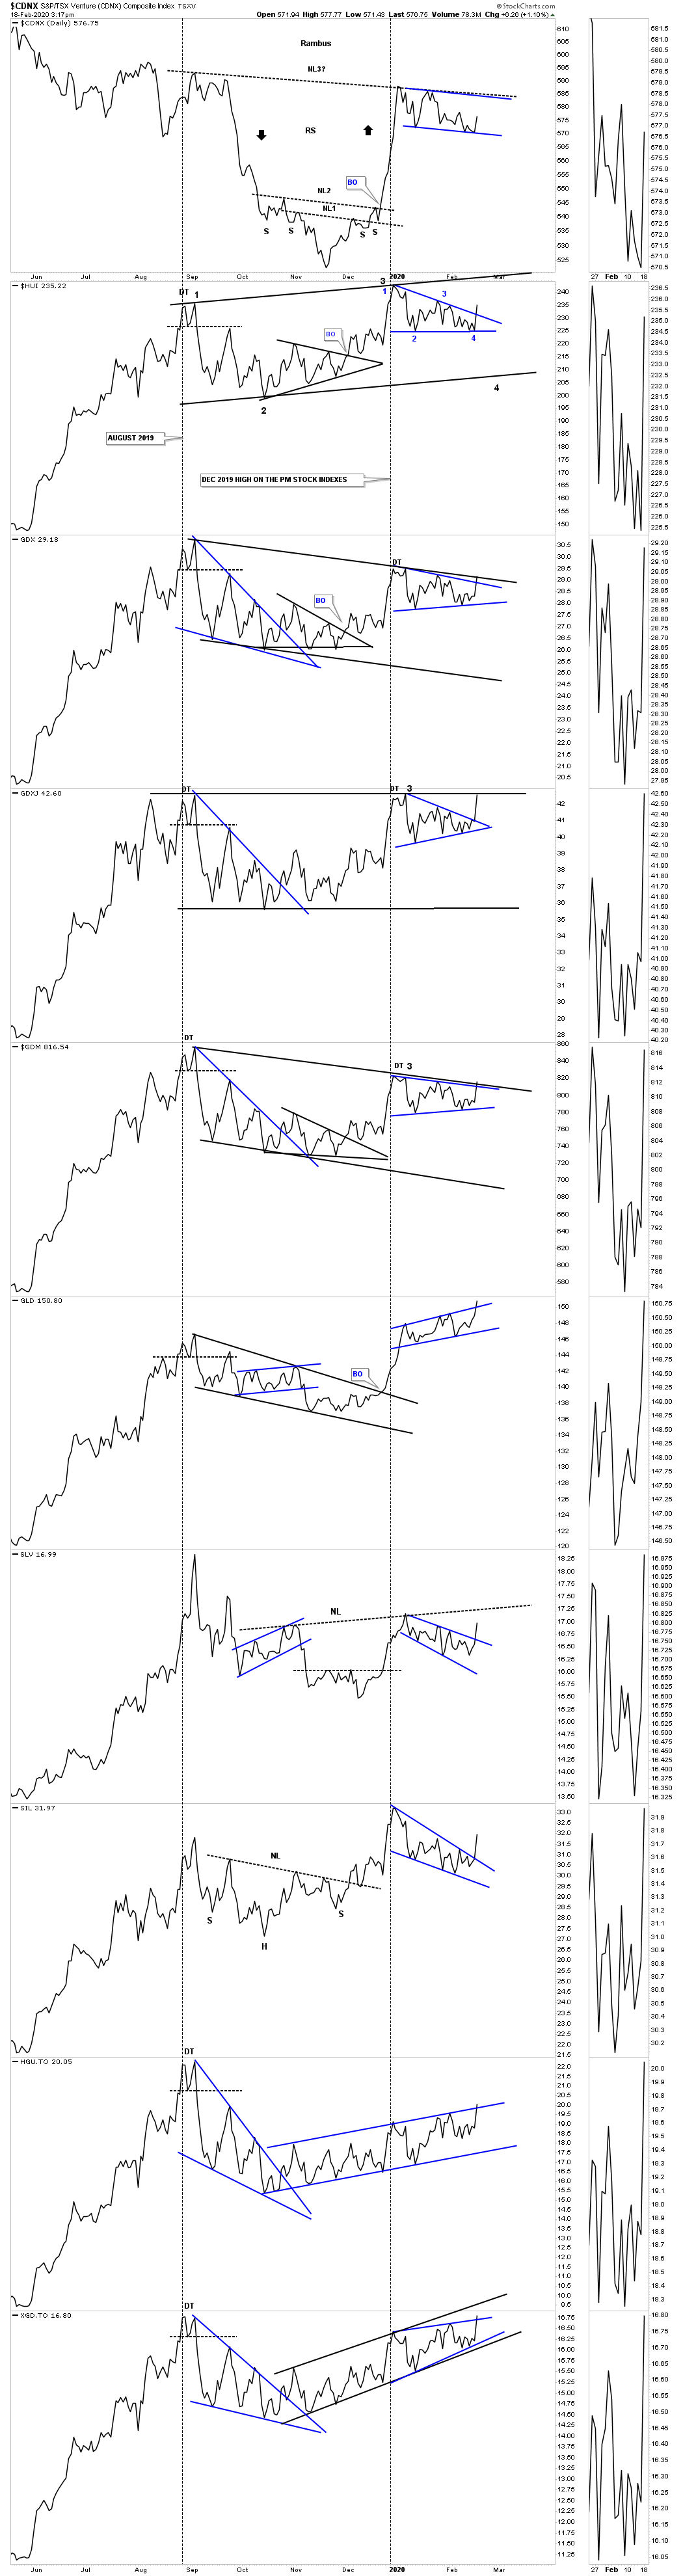
Lets start with the daily line combo chart we've been following very closely which shows many of the smaller blue trading ranges that are breaking out today. As you know I've been looking for one more decline back toward the bottom of the August 2019 trading range to complete a possible 4th reversal point. You can use the HUI as a proxy for the rest of the PM stock indexes which shows where the possible 4th reversal point would be.
If we don't get that 4th reversal point and the PM complex rallies strongly above its August 2019 high then the trading range will have to be either a H&S consolidation pattern or a cup & handle. Note the CDNX which looks like it is trying to put the finishing touches to its 2019 H&S. The GLD is still the strongest area within the PM complex as it is hitting new highs for this rally phase. The 2 Canadian etf's have been building out a nearly 5 month parallel rising channel. Those types of patterns can breakout in either direction but todays price is suggesting that the HGU.TO is likely to breakout to the upside as it's cracking the top rail today.
Click on charts to ENLARGE
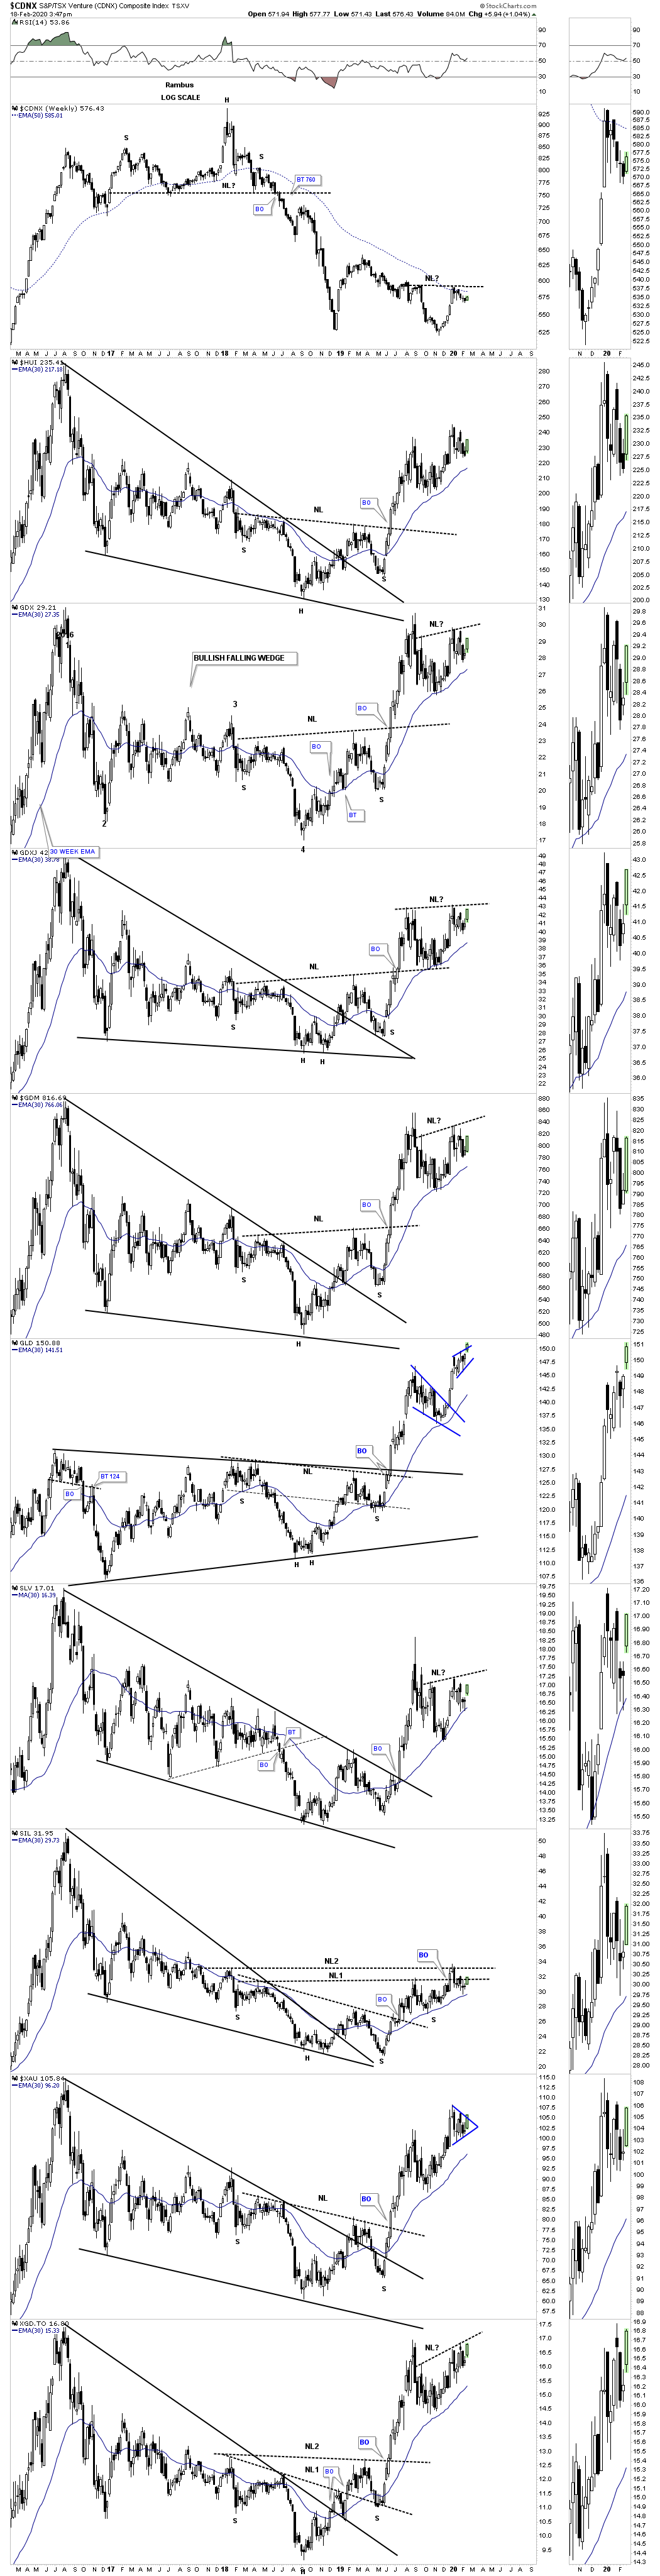
This next chart is the weekly combo chart for the PM complex I've been posting at the end of the week which shows the potential H&S consolidation patterns that have been forming. So far none of the possible H&S consolidation patterns have given way yet. It looks like the GDXJ may be one of the first PM indexes to takeout its neckline which would be bullish for the rest of the PM complex.
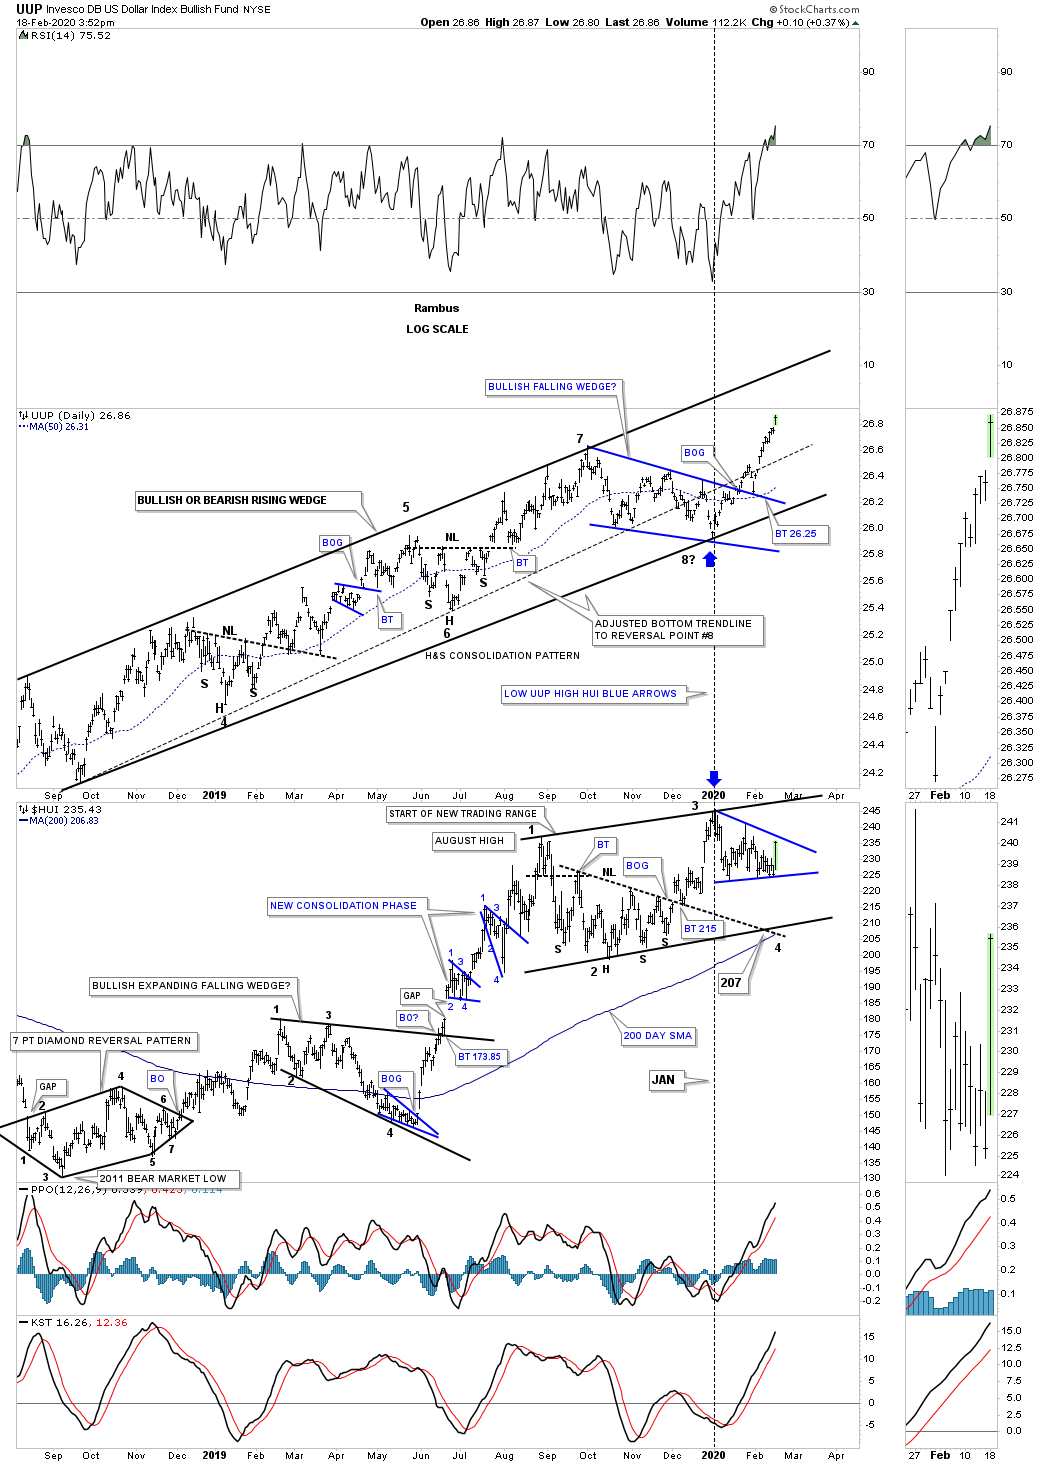
This last chart is the UUP / HUI combo chart we've been following for most of the rising channel on the UUP. This chart shows you a good example of how negative divergences can fail just when you think they will workout. You can see the big breakout move out of the blue bullish falling wedge on the UUP while the HUI has only traded sideway chopping out the blue triangle.
- Rambus