Rolling Returns: Gold Vs. Stocks And Bonds
Building on recent work on the topic, this article examines rolling returns of Gold, Stocks, and Bonds from the early 1970s to the current period.
Over shorter horizons, Gold can outperform stocks 30%-40% of the time, but as that horizon expands to decades, Gold almost always underperforms both stocks and bonds.
Gold is likely best deployed tactically in risk-off environments for stocks. Given its low realized returns and high volatility, it is an expensive macro hedge to carry structurally.
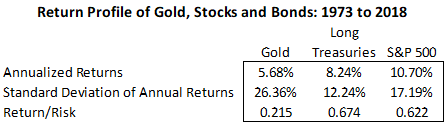
In a recent article entitled Gold vs. Stocks, I illustrated the long-term returns of the precious metal versus the S&P 500 (SPY) and a long duration Treasury Index (TLT). The article sparked a great deal of reader interest with 134 comments at the time I am writing this follow-up. In that article, I showed the long-term total returns and volatility of the three asset classes from 1973 to 2018. Gold has produced the weakest total returns with the highest variability as depicted below.
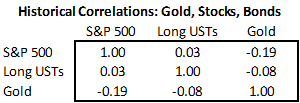
Gold has recently had a bit of a pop - climbing 7%+ in each of June and August - amidst global macro uncertainty and a climbing stock of negative yielding bonds around the globe. In that previous article, I was trying to illustrate that while gold has had a moderately negative correlation with stocks over time, it has historically been an expensive hedge given its low realized returns and high volatility.
Using monthly returns for gold, the S&P 500, and long Treasury bonds back to 1973, I calculated rolling returns for various holdings lengths. In my head, the long-term returns to Gold look much like the picture below where I have calculated rolling 30-year returns. The first calculated period is February 1973 through January 2003, inclusive.
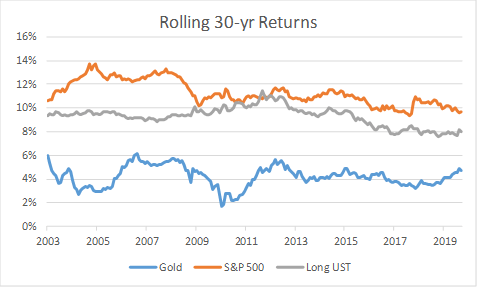 Over that extended time period, which covers much of the investible horizon for many of us on Seeking Alpha, Gold has never had a three decade period where holders of the metal have done better than holders of stocks or long Treasury bonds. Some might question why the dataset starts at 1973. That is the longest dataset available for the bond index. Furthermore, I am using a series of an ounce of spot gold measured in dollars. Before the early 1970s, gold and the dollar moved together since they were linked by the gold standard, which the U.S. exited under the Nixon administration.
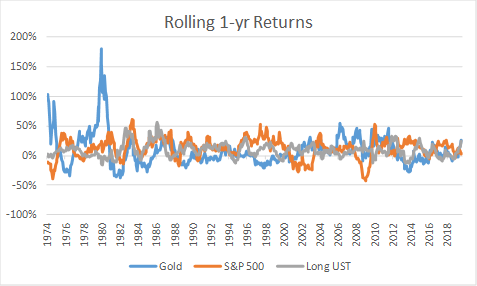
That first table (low returns, high volatility) and first graph (long-run underperformance) suggest limited holdings of gold. To others, however, rolling returns of gold versus stocks and bonds look more like the next graph. Over shorter time intervals, gold has had periods of outperformance, primarily during risk-off environments like 1974, 1980, and 2008. Overall, this analysis has 548 rolling 1-year horizons, and gold has outperformed stocks in 214 of them (39.1%). Gold has outperformed bonds in 224 of them (40.9%).
 Between rolling 1-year returns where Gold outperforms stocks 39% of the time, and rolling 30-year returns where Gold never outperformed stocks in this dataset, we are going to typically see a declining likelihood for Gold outperforming as the horizon extends. By showing these graphs, I want to demonstrate this fact for readers and also highlight the environments when Gold has actually done quite well.
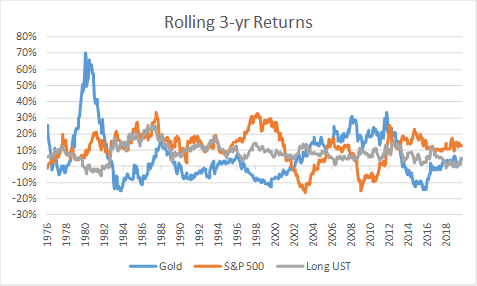
Over rolling 3-year horizons, Gold outperformed stocks 34.3% of the time, and outperformed bonds 36.2% of the time. The largest outperformance came during the late 1970s and early 1980s. The most recent prolonged outperformance for Gold was during the Global Financial Crisis and in its immediate wake as global central banks employed new monetary accommodation tools.
Over rolling 5-year periods, Gold has outperformed both stocks and bonds 39% of the time during this nearly five decade sample period. Interestingly, Gold was more likely to outperform over five years than three years in the sample study. Roughly one-third of the time, Gold averaged double digit returns over a five year horizon.

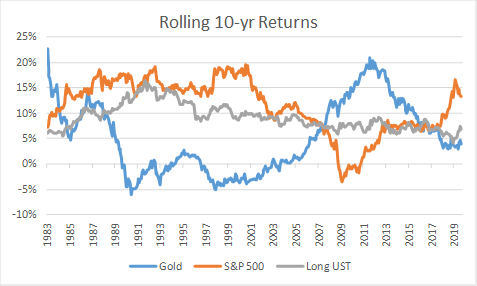
Over rolling 10-year periods, Gold has outperformed stocks 28% of the time and bonds 34% of the time. Gold averaged 20% annualized returns over a decade through mid-2011, a period that overlapped part of the tech bubble and the Great Recession.
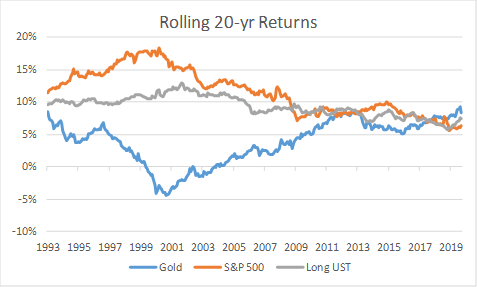
Over rolling 20-year periods, Gold has outperformed stocks and bonds in roughly 9% of observations. As you can tell by the graph, most of the periods with 20-years of relative outperformance by gold are ending in the current market environment. These periods feature two major drawdowns for stocks (tech bubble, financial crisis) that lead to subnormal equity returns. Over the trailing 20-years, Gold has averaged high single digit returns (8.3% annualized through September 2019). Some commenters in the last article noted that the recent 20-year period includes an increased ease of Gold ownership through ETFs that may have structurally boosted demand and returns.
 For me, this analysis suggests that Gold is best used as a tactical instrument in risk-off environments for stocks. A long-term position in gold reduced portfolio returns of a stock and bond portfolio over this entire sample period. Over long-time intervals, this position also would not have reduced portfolio volatility - despite the negative correlation with stocks - since the instrument was itself quite volatile. Gold has had its episodic moments where it would have provided a ballast to portfolio returns in declining stock markets, but owning it over long-time intervals for those moments of outperformance would have proved defeating to growing wealth.
The high returns to bonds shown in these graphs are unlikely to repeat over forward decades as the starting coupon today for Long Treasuries (just over 2%) is much lower than in this historical study. Part of the compensation for bonds is for future expected inflation. As bond yields have come down, the market's expectation for inflation has come down too. With part of Gold's allure a hedge against the declining purchasing power of the dollar, lower future inflation as implied by the market may also reduce Gold's future returns.
You have to time your entry and exit into Gold appropriately. Given Gold's low long-run expected returns and high volatility, timing a Gold bet may be done more effectively through reducing your equity exposure and beta on the margin or through cheaper financial hedges than through a long bet on Gold.
Disclaimer: My articles may contain statements and projections that are forward-looking in nature, and therefore, inherently subject to numerous risks, uncertainties, and assumptions. While my articles focus on generating long-term risk-adjusted returns, investment decisions necessarily involve the risk of loss of principal. Individual investor circumstances vary significantly, and information gleaned from my articles should be applied to your own unique investment situation, objectives, risk tolerance, and investment horizon.
Disclosure: I am/we are long SPY. I wrote this article myself, and it expresses my own opinions. I am not receiving compensation for it (other than from Seeking Alpha). I have no business relationship with any company whose stock is mentioned in this article.
Follow Ploutos and get email alerts