Shale Oil Splutters: Brent on Track for $70 Target $100 in 2020 / Commodities / Crude Oil

 There is a sense oftriumphalism in the tag-line, “U.S.A. is now a net oil exporter”. Reminiscentof “Mission Accomplished”; first it’s not true, second; what’s hiding in thewings is sinister.In February, in thePermian, Initial Production netLegacy-Loss (IPnL), which measures change in production capacity, was down 42%on the peak in May 201898.5% of changes in IPnL can beexplained by changes in trailing average oil price. That sounds blindinglyobvious; but there’s a catch.Shale oil output-growth affectsoil prices; so there’s negative feedback-loop. What happened was legacy-loss inshale caught up, shale is still a “swing producer”; but soon they will need $70WTI.Ten years ago the Saudi’s said $70-to-$80 Brent was “fair”, that’s whatthe world could afford, and what producers needed to bring in new oil, theysaid. They may get that, and more, soon.
Someone who was there told someone I know; that theday-before Deepwater Horizon blew, the HSE fascists had a party; no booze, nosmoking, no trans-fats, no lap-dancers, lots of sugar; quite a party. It was tocelebrate what a great job they had all done. Near-miss incident-reports on notholding handrails going down stairs; had halved, and the numbers of injuriesfrom actually falling down stairs was 25% of two years before. It’s one thingto write and document a fifty-page risk-analysis, it’s another thing to get thebig things right. Not many corporate risk-analyses in 2014 had a line on“What-if oil prices halve, or more?” The question that should be asked now, is“What if they double, or more”, as shale output growth increasingly fails tofill the gap, and more than likely conventional E&P won’t be able to bringon capacity to play catch-up; fast enough.
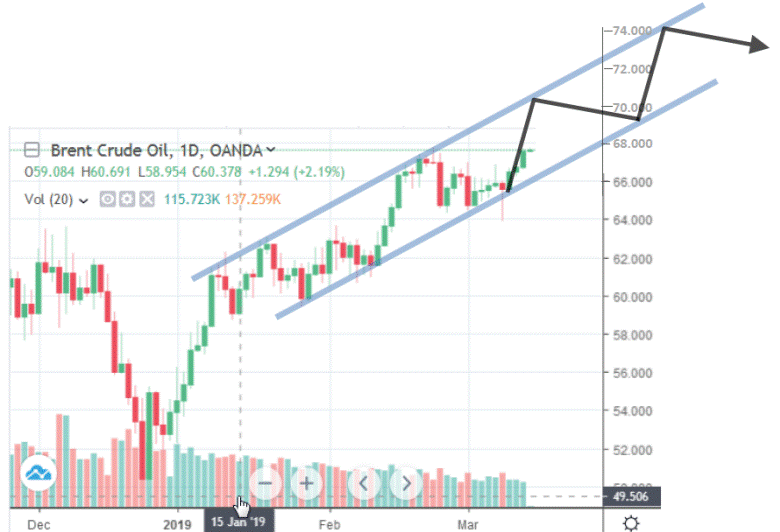
In late 2018, oil prices got hammered because President Trump playeda trick on OPEC, by issuing waivers on Iranian sanctions. OPEC had ramped up tofill that gap, so then there was a temporary glut; that’s been sorted; nowBrent is firmly on track to the level achieved in October 2018 ($84).
It could go more this time, because un-noticed by the flag-wavers,shale is spluttering. The number towatch is initial production (IP) by month as a function of trailing average price.IP is not reported directly by EIA in their monthly Drilling ProductivityReport, but you can work it out from the numbers they do report. TheoreticallyIP minus Legacy loss ought to equal the monthly change in total production,long-term it does, see chart:
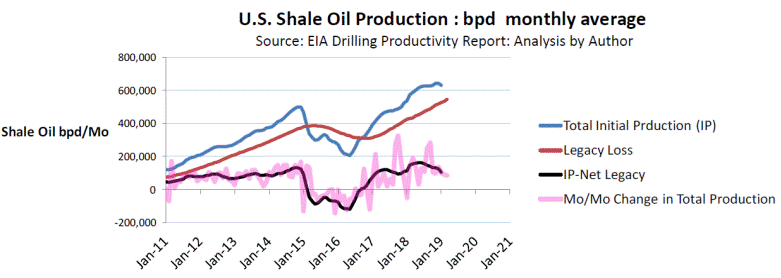
Short term the change in total production (how muchwas reported this month minus how much was reported, last month – evenroustabouts can do the math on that one), bounces around.
If I was an economist I would say that proves theexistence of Black Swans and means that the Federal Reserve should dropinterest rates, another plausible explanation could be that as production wentup, the logistics for getting the oil to market got stretched.
Notice that legacy-loss is climbing in a prettystraight line; total production growth has stalled; whenever; (if-ever); thosetwo lines come together, that will be “Peak-Shale”. By the way I smoothed legacy-loss line becausein Eagle Ford for a few months the reported numbers went haywire, I’m assumingthat was a reporting error, so I treated it as an outlier (i.e. I ignored thatdata).
Currently 77% of IP is used to replace legacy loss; whichis the root of the problem with shale oil. IP depends on the oil price, whenthat’s high operators drill and complete, when it’s low they polish theircowboy-boots, which is about the only other thing to do in Permian.
Shale operators say they can make money at $28 WTI(about $38 Brent). Just one small point, whenever WTI dips below $50 ($60Brent), they start to pull back, which suggests that these days they don’t makemoney at that price.
Yes of course, history is an unreliable guide to the future,but if you couldn’t do something in the past (i.e. make money at $50 WTI), it’sunreasonable to tell your investors that you can. Here are some models of thepast showing that U.S. Shale oil Initial Production, is driven ONLY by theprice four and six months in the past:
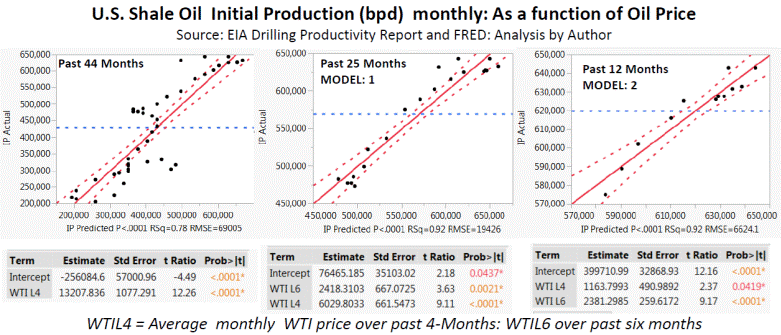
The model for the past 44-months has only onevariable, so there cannot be any question about auto-correlation skewing theanswer.
Above 400,000 the direction changed, I thought “I’mnot interested in what happened more than two years ago, I’m interested inwhat’s happening now,” so I just ran the numbers for the past 25 months.
In the 25-month model both the price explanatoryvariables are positive (i.e. no chance of auto correlation), the model saysthat roughly 30% of changes of IP can be explained by changes in WTI-L6 and 70%can be explained by changes in WTI-L4.
A few months ago, I also noticed that over the past12-months, the slope of the line of IP as a function of price has beendropping, so I modeled for just 12-Months (Model-2). I don’t like to makeprojections (which is obviously where I’m going), from such a short history,but that’s the problem projecting shale output, there’s not much history.
So IP is predictable from WTI. To arrive at a model of thetheoretical change in Total Production, you need to take away legacy-loss thismonth. Legacy loss averages about 6.4% of last month’s Total Production. Whylast month? Well legacy loss this month also correlates with Total Productionthis month, but I can’t use that because that’s the number I’m trying to find.
![]()
Obviously for the first line of the model I use actual for TP lastmonth, got to start somewhere. Seeing as some commentators on my previous postwere interested in the detail, line by line, I’m showing how the arithmetic toget to a model of total monthly production was worked out; enjoy!
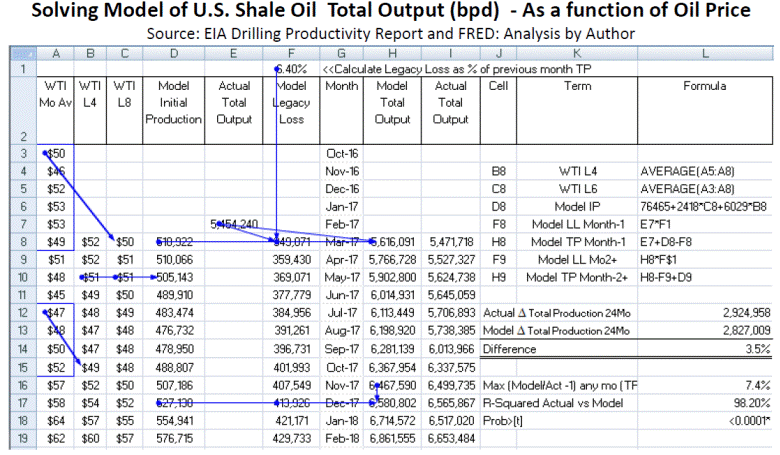
That model was solved for the future, for differentscenarios of WTI going forwards from today, i.e. the $90 scenario, was for“What-if WTI goes to $90 next month and stays there?” This is how that turned out: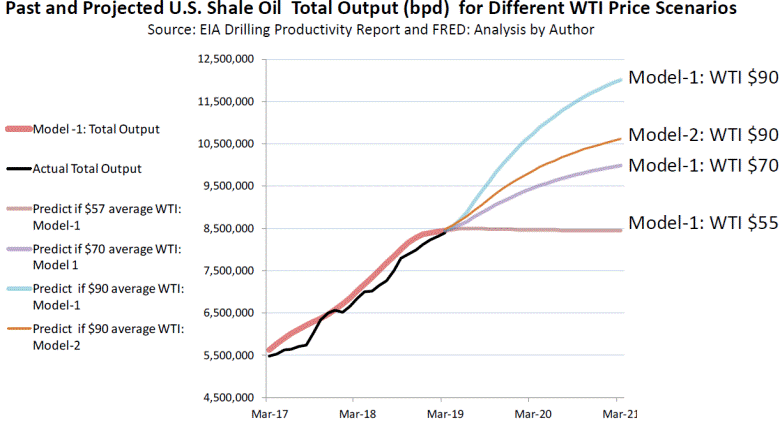
Comments:
Of course correlation does not prove causation, butlike the correlation between “holding hand-rails” and “not falling downstairs”, correlation that explains the past, is not a bad starting point.
$100 and $150 ought to be scenarios for Brent in 2020in any coherent risk analysis, another word for that is a global recession,whilst conventional E&P catches up, because the evidence of the recent pastis that U.S. Shale oil won’t.
By Andrew Butter
Twenty years doing market analysis and valuations for investors in the Middle East, USA, and Europe. Ex-Toxic-Asset assembly-line worker; lives in Dubai.
© 2019 Copyright Andrew Butter- All Rights Reserved
Disclaimer: The above is a matter of opinion provided for general information purposes only and is not intended as investment advice. Information and analysis above are derived from sources and utilising methods believed to be reliable, but we cannot accept responsibility for any losses you may incur as a result of this analysis. Individuals should consult with their personal financial advisors.
Andrew Butter Archive |
© 2005-2019 http://www.MarketOracle.co.uk - The Market Oracle is a FREE Daily Financial Markets Analysis & Forecasting online publication.