Silver Mining Stocks Fundamentals / Commodities / Gold and Silver Stocks 2019

 The major silver minershave rallied higher on balance in recent months, enjoying a young upleg. That’s a welcome change after they suffered amiserable 2018. Times are tough for silverminers, since silver’s prices have languished near extreme lows relative togold. That has forced many traditionalsilver miners to increasingly diversify into gold. The major silver miners’ recently-released Q4’18results illuminate their struggles.
Four times a yearpublicly-traded companies release treasure troves of valuable information inthe form of quarterly reports. Requiredby the US Securities and Exchange Commission, these 10-Qs and 10-Ks contain thebest fundamental data available to traders. They dispel all the sentiment distortions inevitably surrounding prevailingstock-price levels, revealing corporations’ underlying hard fundamentalrealities.
While 10-Qs with filingdeadlines of 40 days after quarter-ends are required for normal quarters, 10-Kannual reports are instead mandated after quarters ending fiscal years. Most silver miners logically run theiraccounting on calendar years, so they issue 10-Ks after Q4s. Since these annual reports are larger and must be audited by independent CPAs, theirfiling deadlines are extended to 60 days after quarter-ends.
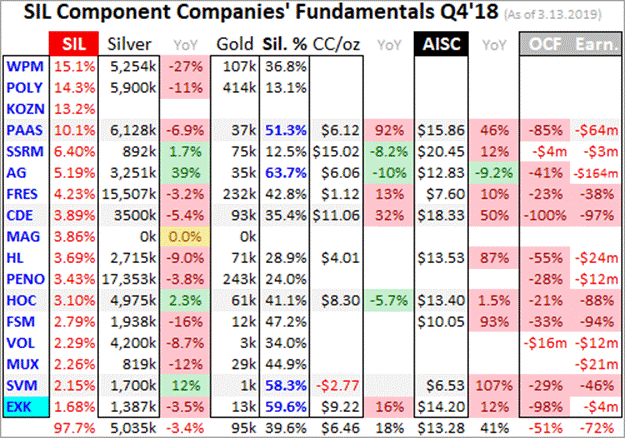
The definitive list ofmajor silver-mining stocks to analyze comes from the world’s most-popular silver-stockinvestment vehicle, the SIL Global X Silver Miners ETF. Launched way back in April 2010, it hasmaintained a big first-mover advantage. SIL’s net assets were running $362m in mid-March near the end of Q4’searnings season, 6.1x greater than its next-biggest competitor’s. SIL is the leading silver-stock benchmark.
In mid-March SILincluded 21 component stocks, which are weighted somewhat proportionally totheir market capitalizations. This list includesthe world’s largest silver miners, including the biggest primary ones. Every quarter I dive into the latestoperating and financial results from SIL’s top 17 companies. That’s simply an arbitrary number that fitsneatly into the table below, but still a commanding sample.
As of mid-March thesemajor silver miners accounted for fully 97.7% of SIL’s total weighting. In Q4’18 they collectively mined 75.5m ouncesof silver. The latest comprehensive dataavailable for global silver supply and demand came from the Silver Institute inApril 2018. That covered 2017, whenworld silver mine production totaled 852.1m ounces. That equates to a run rate around 213.0mounces per quarter.
Assuming that miningpace persisted to Q4’18, SIL’s top 17 silver miners were responsible for about35% of world production. That’s relativelyhigh considering just 28% of 2017’s global silver output came from primarysilver mines! 36% came from lead/zinc mines,23% from copper, and 12% from gold. 7/10ths of all silver produced is merelyan other-metals-mining byproduct. Primary silver mines and miners are fairly rare.
Scarce silver-heavydeposits are required to support primary silver mines, where over half their revenue comes fromsilver. They are increasingly difficultto discover and ever-more expensive to develop. And silver’s challenging economics of recent years argue against minerseven pursuing it. So even traditional majorsilver miners have shifted their investment focus into actively diversifyinginto far-more-profitable gold.
Silver price levels arebest measured relative to prevailing gold prices, which overwhelmingly drive silverprice action. Q4’18 saw the worst Silver/Gold Ratio witnessedin nearly a quarter century! The SGR collapsed to 86.3x in late November,an extreme 23.8-year secular low. The rawsilver price fell under $14 in mid-November, a major 2.8-year low. With such a rotten silver environment, silverminers had to struggle.
The largest primary silverminers dominating SIL’s ranks are scattered around the world. 11 of the top 17 mainly trade in US stockmarkets, 3 in the United Kingdom, and 1 each in South Korea, Mexico, and Peru. SIL’s geopolitical diversity is good forinvestors, but makes it difficult to analyze and compare the biggest silverminers’ results. Financial-reportingrequirements vary considerably from country to country.
In the UK companies reportin half-year increments instead of quarterly. Some silver miners still publish quarterly updates, but their data islimited. In cases where half-year datais all that was made available, I split it in half for a Q4 approximation. Canada has quarterly reporting, but thedeadlines are looser than in the States. Some Canadian miners trading in the US really drag their feet in gettingquarterly results out.
The big silver companiesin South Korea, Mexico, and Peru present other problems. Their reporting is naturally done in theirown languages, which I can’t read. Somerelease limited information in English, but even those translations can be difficultto interpret due to differing accounting standards and focuses. It’s definitely challenging bringing all thequarterly data together for the diverse SIL-top-17 silver miners.
But analyzing them in theaggregate is essential to understand how they are faring. So each quarter I wade through all availableoperational and financial reports and dump the data into a big spreadsheet foranalysis. Some highlights make it intothis table. Blank fields mean a companyhadn’t reported that data by mid-March, as Q4’s earnings season wounddown. Some of SIL’s components report ingold-centric terms.
The first couplecolumns of this table show each SIL component’s symbol and weighting withinthis ETF as of mid-March. While most ofthese stocks trade on US exchanges, some symbols are listings from companies’primary foreign stock exchanges. That’sfollowed by each miner’s Q4’18 silver production in ounces, along with itsabsolute year-over-year change. Nextcomes this same quarter’s gold production.
Nearly all the majorsilver miners in SIL also produce significant-to-large amounts of gold! That’s truly a double-edged sword. While gold really stabilizes and boostssilver miners’ cash flows, it also retards their stocks’ sensitivity to silveritself. So the next column reveals how pure these elite silver miners are,approximating their percentages of Q4’18 revenues actually derived fromsilver. This is calculated one of twoways.
The large majority ofthese top SIL silver miners reported total Q4 revenues. Quarterly silver production multiplied bysilver’s average price in Q4 can be divided by these sales to yield an accuraterelative-purity gauge. When Q4 salesweren’t reported, I estimated them by adding silver sales to gold sales basedon their production and average quarterly prices. But that’s less optimal, as it ignores anybase-metals byproducts.
Next comes the majorsilver miners’ most-important fundamental data for investors, cash costs andall-in sustaining costs per ounce mined. The latter directly drives profitability which ultimately determines stockprices. These key costs are alsofollowed by YoY changes. Last but notleast the annual changes are shown in operating cash flows generated and hardGAAP earnings, with a couple exceptions necessary.
Percentage changes aren’trelevant or meaningful if data shifted from positive to negative or vice versa,or if derived from two negative numbers. So in those cases I included raw underlying data rather than weird ormisleading percentage changes. This wholedataset together offers a fantastic high-level read on how the major silverminers are faring fundamentally as an industry. They definitely struggled in Q4.
SIL’s performance certainlyreflects the challenges of profitably mining silver when its price languishesso darned cheap. In 2018 SIL plunged23.3%, amplifying silver’s own 8.6% loss by 2.7x. Silver’s weakest prices relative to gold inalmost a quarter century wreaked havoc on silver-mining sentiment. Investors didn’t want anything to do withsilver miners, and their own managements seemed almost as bearish.
In Q4’18 silver’saverage price dropped 12.9% YoY to just $14.53. That was disproportionally worse than gold, which saw its average pricedecline 3.8% YoY. Such deep lows exacerbatedthe pall of despair that is plaguing the silver-mining industry. While production decisions aren’t madequarter by quarter, it sure felt like the seriously-weak silver prices werechoking off output. Production is thelifeblood of silver miners.
The SIL top 17’s collectivesilver production fell 3.9% YoY in Q4’18 to 75.5m ounces. Interestingly that’s right in line with whatthe major gold miners ofGDX experienced that quarter, a 4%ish YoY slide when adjusted for mega-mergers. The major silver miners could be experiencinga peak-gold-like decline in their silver production. Peak silver isn’t discussed as much, butworld silver mine output has been shrinking.
According to the SilverInstitute’s latest annual World Silver Survey current to 2017, world silvermined supply peaked at 895.1m ounces in 2015. It nosed over a slight 0.7% in 2016, but accelerated sharply to another4.1% drop in 2017. So the SIL top 17’soutput contraction in Q4’18 is just continuing this trend. Silver mining has been starved of capitalsince 2013, when silver plummeted 35.6% on a 27.9% gold collapse!
Silver-mining stocks havebeen something of a pariah to even contrarian investors for much of the timesince then. That’s left their prices largelydrifting at relatively-low levels, making it more difficult to obtain financingto expand operations. Investors haven’tbeen interested in silver-stock shares, leaving miners wary of issuing more toraise capital with stock prices so low. Thatcan really dilute existing shareholders.
With the major silverminers unable or unwilling to invest in developing new silver mines and expansionsto offset their depleting output, it has to decline. 11 of the 15 top SIL components reporting Q4’18silver production mined fewer ounces than in Q4’17. All 15 together averaged silver outputshrinkage of 3.4% YoY. That’s a sharpcontrast to these same miners’ gold production, which grew an average of 7.9% YoY.
In overall total terms,the SIL top 17’s 1.4m ounces of gold mined in Q4’18 still slipped 1.5%YoY. But with total silver productionsliding more than gold, the major silver miners’ long ongoing diversification intothe yellow metal continued. At the bombed-outsilver prices of recent years, the economics of gold mining are way superior tosilver mining. The traditional majorsilver miners are painfully aware of this and acting on it.
Silver mining is ascapital-intensive as gold mining, requiring similar large expenses to plan,permit, and construct new mines, mills, and expansions. It needs similar fleets of heavy excavatorsand haul trucks to dig and move the silver-bearing ore. Similar levels of employees are necessary torun silver mines. But silver generates much-lower cash flows than gold due itslower price. Silver miners have been forcedto adapt.
The major silver minerscontinued their trend of diversifying into gold at silver’s expense in Q4’18. SIL’s largest component Wheaton PreciousMetals was a great example of this. Itused to be known as Silver Wheaton, a pure silver-streaming play. Back in May 2017 it changed its name andsymbol to reflect the fact it would increasingly diversify into gold. In Q2’17 WPM streamed 7,192k and 80k ouncesof silver and gold.
Back then fully 61.9% ofWPM’s sales still came from silver, qualifying it as a primary “miner”. Fast-forward to Q4’18 and WPM’s silver output plunged 27.1% YoY to 5,254k ounces! But its gold mined rose 10.5% YoY to 107kounces. That pushed the impliedpercentage of WPM’s revenues down to just 36.8% silver, way below the 50%primary threshold. Like it or not, thesilver-mining industry is increasingly turningyellow.
This strategic shift isgood and bad. The major silver miners’ growingproportion of gold output is helping these companies weather this long darkwinter in silver prices. But lowerpercentages of sales generated from silver leaves their stock prices and SIL less responsive to silver price moves. Silver stocks’ leverage to silver is the mainreason investors buy them and their ETFs. Their shift into gold is really degrading that.
In Q4’18 the top 17 SILsilver miners averaged just 39.6% of their sales from silver. Only Pan American Silver, First MajesticSilver, Silvercorp Metals, and Endeavour Silver qualified as primary silverminers with over half their revenues from the white metal. While still low, that 39.6% average of SILwas actually considerably better than Q4’17’s 36.0% despite the ongoing transitioninto gold. But that’s not a trend shift.
In Q4’17 SIL’s componentsincluded Tahoe Resources, which was bought out by Pan American Silver in mid-November. Tahoe owned what was once the world’s largest silver mine, Escobal inGuatemala. It produced 5,700k ounces inQ1’17! But Guatemala’s government shut itdown after a frivolous lawsuit by anti-mining activists. I last discussed the whole Tahoe saga indepth in my Q3’18 essay on silver miners’ results.
By Q4’17 Escobal’sproduction had dropped to zero, leaving Tahoe’s silver purity at 0.0%. That dragged down the SIL top 17’s average,leaving it artificially low. But PanAmerican buying Tahoe for both its gold production and hopes of convincing Guatemalato allow Escobal to reopen killed Tahoe’s stock and purged it from SIL’sranks. Endeavour Silver edged into thetop 17 to take its place, with 59.6% of sales from silver.
If Tahoe’s silverpurity is excluded from Q4’17’s overall calculation while Endeavour is added, SILwould have averaged 39.9%. So incomparable terms Q4’18’s 39.6% remains a declining trend. Primary silver miners continue to get rarer,they may even be a dying breed. That hasforced SIL’s managers to really scrape the bottom of the barrel to find componentsto fill their ETF. That’s what happenedwith Korea Zinc.
This is no silverminer, but a base-metals smelter! In mid-March it commanded a hefty 13.2%weighting in SIL, over 1/8th the total. I’ve searched and searched, but can’t find English financial reports forthis company. But in 2017 it reportedsmelting 66.2m ounces of silver, a 16.6m quarterly pace. I bet there’s not a single SIL investorlooking for base-metals-smelting exposure! Global X really ought to remove it entirely.
The capital allocatedto Korea Zinc could be spread across the remaining SIL componentsproportionally, reallocating and modestly upping their weightings. But the fact Korea Zinc even ever made it intoSIL is a testament to how rarified the ranks of major silver miners havebecome. That won’t reverse unless silver mean reverts dramaticallyhigher relative to gold andremains at much-better price levels for years on end.
With SIL-top-17 silverproduction sliding 3.9% YoY in Q4’18, the per-ounce mining costs should’ve risenproportionally. Silver-mining costs arelargely fixed quarter after quarter, with actual mining requiring the same levelsof infrastructure, equipment, and employees. So the lower production, the fewer ounces to spread mining’s big fixedcosts across. SIL’s major silver minersindeed reported far-higher costs lastquarter.
There are two majorways to measure silver-mining costs, classic cash costs per ounce and the superiorall-in sustaining costs. Both are usefulmetrics. Cash costs are the acid test ofsilver-miner survivability in lower-silver-price environments, revealing theworst-case silver levels necessary to keep the mines running. All-in sustaining costs show where silverneeds to trade to maintain current mining tempos indefinitely.
Cash costs naturallyencompass all cash expenses necessaryto produce each ounce of silver, including all direct production costs,mine-level administration, smelting, refining, transport, regulatory, royalty,and tax expenses. In Q4’18 these SIL-top-17silver miners reported cash costs averaging $6.46 per ounce. While that surged 37.0% YoY, it still remainsfar below prevailing prices. Silver minersface no existential threat.
The major silver miners’average cash costs vary considerably quarter-to-quarter, partially depending onwhether or not Silvercorp Metals happens to be in the top 17 or not. This Canadian company mining in China has negative cash costs due to massivebyproduct credits from lead and zinc. Soover the past couple years, SIL-top-17 average cash costs have swung wildly rangingall the way from $3.95 to $6.75.
Way more important thancash costs are the far-superior all-in sustaining costs. They were introduced by the World GoldCouncil in June 2013 to give investors a much-better understanding of what itreally costs to maintain silver mines as ongoing concerns. AISCs include all direct cash costs, but thenadd on everything else that is necessary tomaintain and replenish operations at current silver-production levels.
These additionalexpenses include exploration for new silver to mine to replace depletingdeposits, mine-development and construction expenses, remediation, and minereclamation. They also include thecorporate-level administration expenses necessary to oversee silver mines. All-in sustaining costs are themost-important silver-mining cost metric by far for investors, revealing silverminers’ true operating profitability.
The SIL-top-17 silverminers reported average AISCs of $13.28 in Q4’18, surging 31.0% higherYoY! That is troubling, climbing vexinglyclose to silver’s latest major secular low of $13.99 in mid-November. While Q1’19’s average silver price of $15.55 sofar is much better, these profit margins are still tight for a long-strugglingindustry. Thankfully the major silverminers’ cost structure is better than that number implies.
The highest AISCs byfar in Q4 came from SSR Mining, which was formerly known as Silver Standard Resources. They climbed another 11.7% YoY to nosebleedlevels of $20.45 per ounce! But that’snot a normal situation. SSRM too is shiftinginto gold, gradually winding down itsold Pirquitas silver mine. As it depletes,there are fewer ounces to spread its fixed costs of mining across which drivesup per-ounce costs.
Excluding SSRM, therest of the SIL top 17 reporting AISCs in Q4’18 averaged a more-reasonable$12.48 per ounce. And these major silverminers providing AISC outlooks for 2019 projected similar levels near $12.70. This is still on the high side, as the SILtop 17’s AISCs ran $10.14, $10.92, $10.93, and $13.53 in the preceding fourquarters. But $12.48 is still profitableeven with silver seriously languishing relative to gold.
Silver-mining profitsreally leverage higher silver prices, and big earnings growth attracts ininvestors to bid up stock prices. In Q4’18silver averaged $14.53 per ounce. At theSIL top 17’s average AISCs ex-SSRM of $12.48, that implies the major silverminers as an industry were earning profits of $2.05 per ounce. Those are going to grow majorly this quarter. The almost-over Q1’19 has seen silver average$15.55.
With Q4’s AISCs amongthe highest silver miners have reported in years, they could very well declinein Q1. But assume they remain stablenear $12.48. That implies the major silverminers earned about $3.07 per ounce in Q1. A mere 7.0% quarter-on-quarter silver rally could catapult silver-miningprofits a massive 49.8% higher QoQ! This awesome profits leverage to silver iswhy silver stocks amplify silver’s upside.
Of course the greater asilver miner’s exposure to silver, the more its stock will surge as silver advances. First Majestic Silver had the highest silver purityin Q4 at 63.7% of its revenues derived from silver. Thus AG’s stock should thrive with highersilver prices. But SSR Mining’s mere12.5% silver purity pretty much leaves silver irrelevant. As SSRM is overwhelmingly a primary goldminer, higher silver won’t move the needle.
So investors who wantclassic silver-stock exposure to leverage silver uplegs need to be smart abouthow they deploy capital. While buyingSIL is easy, it is dominated by primary gold miners. And who on earth wants over 1/8th of their investmentwasted in a giant base-metals smelter? The greatest gains in future silver uplegs will come in the stocks withthe most silver exposure. They are what investors need to own.
Despite slowing silverproduction and their ongoing diversification into gold, the major silver minersstill remain well-positioned to see hugeprofits growth as silver marches higher. Especially the primary ones. But withsilver hammered to major secular lows in Q4’18, the accounting results of the SIL-top-17silver miners were quite weak. 3.9%-lowerproduction combined with 12.9%-lower average silver prices wasn’t pretty.
The followingaccounting comparisons exclude SIL’s largest component WPM. For some reason it waits until the end ofMarch to report Q4 results, which is incredibly disrespectful to its shareholders. Q4 data is getting stale with Q1 ending. There’s no excuse to delay reporting withmodern automated accounting systems gathering all data in real-time. For workflow reasons I had to write this essaybefore WPM reported.
Ex-WPM, the SIL top 17 sold$3.4b worth of metals in Q4’18, which was down 10.9% YoY. Given lower silver production and much-lowersilver prices that was relatively good. But cash flows generated from operations collapsed 52.5% YoY to $444m inQ4. That means less capital available tofinance mine expansions and new mine builds. Overall corporate treasuries at these companies fell 33.0% YoY to $2.6b.
Surprisingly thehard-GAAP-earnings picture actually improved over Q4’17, though still remainedweak. Excluding WPM, the SIL-top-17silver miners lost $202m in Q4’18. Thatcut in half Q4’17’s total losses of $412m. But both quarters’ accounting profits were skewed by big non-cash impairment charges. When lower-silver-price forecasts reduceeconomic reserves at mines, those perceived losses must be recognized.
AG wrote off $168m ofits mines’ carrying value on its books in Q4’18 due to lower reserves driven bylower metals prices. The grades withinindividual ore bodies vary widely. Silver that is economic to mine at $20 might not be worth extracting at$15, so companies have to cut their reserves and flush those non-cash lossesthrough their income statements. PAASreported a smaller $28m impairment charge as well.
Together these two$196m writedowns alone accounted for 97% of the major silver miners’ Q4losses. But even without them most ofthe other SIL top 17 still reported mild-to-moderate GAAP losses with thesilver prices so darned low. Thecomparable Q4’17 results had big writedowns too, primarily $547m by Volcan tomeet new accounting standards demanded by another company that bought 55% ofits stock.
While the major goldminers had no excuse for their huge impairment charges inQ4’18 since gold was stable last year, silver miners did since silver washammered. As silver mean reverts higherwith gold and outpaces its rallying, the major silver miners’ GAAP profits willimprove radically. That will attract ina lot more investors, especially to the primary silver miners. Those capital inflows ought to drive massivegains.
Silver’s last majorupleg erupted in essentially the first half of 2016, when silver soared 50.2%higher on a parallel 29.9% gold upleg. SIL blasted 247.8% higher in just 6.9 months,a heck of a gain for major silver stocks. But the purer primary silver miners did far better. The purest major silver miner First Majestic’sstock was a moonshot, skyrocketing a staggering 633.9% higher in that sameshort span! SIL’s gains are muted.
The key takeaway here is avoid SIL. The world’s leading silver-stock ETF is increasinglyburdened with primary gold miners with insufficient silver exposure. And having over 1/8th of your capitalallocated to silver miners squandered in Korea Zinc is sheer madness! If you want to leverage silver’s coming hugemean reversion higher relative to gold, it’s far better to deploy in smallerpurer primary silver miners alone.
One of my core missionsat Zeal is relentlessly studying the silver-stock world to uncover the stockswith superior fundamentals and upside potential. The trading books in both our popular weekly and monthly newsletters arecurrently full of these better gold and silver miners. Mostly added in recent months as these stocks recovered from deep lows,our unrealized gains are already running as high as 87% this week!
If you want to multiplyyour capital in the markets, you have to stayinformed. Our newsletters are agreat way, easy to read and affordable. They draw on my vast experience, knowledge, wisdom, and ongoing researchto explain what’s going on in the markets, why, and how to trade them with specificstocks. As of Q4 we’ve recommended andrealized 1076 newsletter stock trades since 2001, averaging annualized realizedgains of +16.1%! That’s nearly doublethe long-term stock-market average. Subscribe today for just $12per issue!
The bottom line is themajor silver miners are struggling. Withsilver falling to nearly a quarter-century low relative to gold in Q4, theminers’ results were naturally weak. Mining costs surged as production kept waning, reflecting the ongoingtrend of major silver miners increasingly diversifying into gold. But silver-mining profits are still primed toexplode higher as silver continues climbing in its young upleg with gold.
There aren’t enough majorprimary silver miners left to flesh out their own ETF, which is probably whySIL is dominated by gold miners. While itwill rally with silver amplifying its gains, SIL’s upside potential is justdwarfed by the remaining purer silver stocks. Investors will be far-better rewarded buying them instead of settlingfor a watered-down silver-miners ETF. Theirstocks will really surge as silver continues recovering.
Adam Hamilton, CPA
So how can you profit from this information? We publish an acclaimed monthly newsletter, Zeal Intelligence , that details exactly what we are doing in terms of actual stock and options trading based on all the lessons we have learned in our market research. Please consider joining us each month for tactical trading details and more in our premium Zeal Intelligence service at … www.zealllc.com/subscribe.htm
Questions for Adam? I would be more than happy to address them through my private consulting business. Please visit www.zealllc.com/adam.htm for more information.
Thoughts, comments, or flames? Fire away at zelotes@zealllc.com . Due to my staggering and perpetually increasing e-mail load, I regret that I am not able to respond to comments personally. I will read all messages though and really appreciate your feedback!
Copyright 2000 - 2019 Zeal Research ( www.ZealLLC.com )
Zeal_LLC Archive |
© 2005-2019 http://www.MarketOracle.co.uk - The Market Oracle is a FREE Daily Financial Markets Analysis & Forecasting online publication.