Silver Price Analysis / Commodities / Gold and Silver 2018
LatestPrice – $16.47
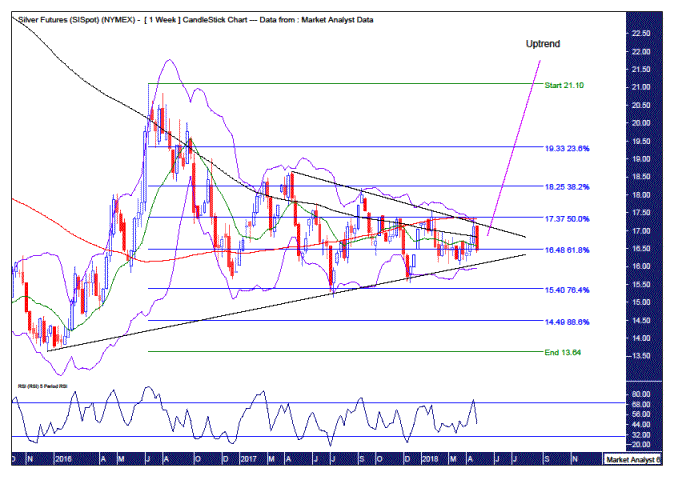
Pattern – price looks to have been in a corrective patternever since the impulsive move up off the December 2015 low culminating in the July2016 high. I expect this corrective phase is in its very final stages.
WeeklyChart

BollingerBands – price has been toing and froing between the upper and lower bands whichis typical of corrective action. Price is now back at the middle band and thistime I doubt price will continue on down to the lower band. Instead, I expectsupport to kick in here and send back up and beyond to commence the next uplegof this rally that began in December 2015.
Trendlines – price has been finding support and resistance at each trend line and isnow approaching the apex. A big move looks imminent, and I favour that move tobe up.
Fibonacci– the low of this corrective phase was around support from the 76.4% levelwhich is a top spot to look for a corrective low.
Movingaverages – now in a bullish position with the 100 week moving average (red)above the 200 week moving average (black).
RSI– last week’s move down saw this indicator move into weak territory but I amnot reading much into that. More interesting is that the previous low wasunable to manage entering oversold territory while the previous high got intooverbought territory which tells me price is looking stronger overall.
MonthlyChart

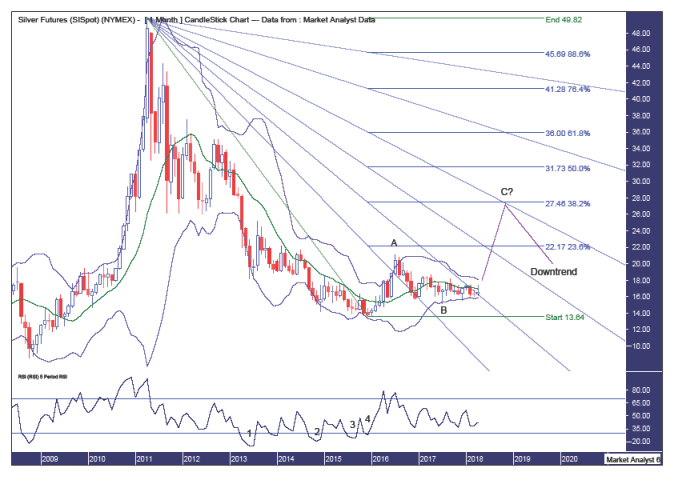
Pattern – I believe an ABC correction is at hand with pointsA and B already in place with price set to put on a powerful rally into a pointC high. After that I expect the overall downtrend to resume.
BollingerBands – these bands have narrowed considerable suggesting a big move in onedirection is likely approaching. I am betting that direction is up.
Fibonacci– after finding support at the 23.6% angle price has moved to the 38.2% anglewhere it resides currently. I am looking for a solid move higher now and onepotential area to look for a rally high is the 61.8% angle. This angleintersects with the 38.2% retracement level of $27.46 around October 2018 sothat is some potential timing for a rally high.
RSI– the low set in December 2015 coincided with four bearish divergences andsince then this indicator got into overbought territory but has failed to getback into oversold territory implying inherent price strength despite therelatively low price.
Summingup – looking for an explosive rally to commence imminently with potential forprice to rise over 50% from current levels in a relatively short space of time.
By Austin Galt
Austin Galt has previously worked as a stockbroker and investment banker while studying technical analysis for over two decades. He is also the author of the book White Night: A Colombian Odyssey
Email - info@thevoodooanalyst.com
© 2018 Copyright The Voodoo Analyst - All Rights Reserved
Disclaimer: Theabove is a matter of opinion provided for general information purposes only andis not intended as investment advice. Information and analysis above arederived from sources and utilising methods believed to be reliable, but wecannot accept responsibility for any losses you may incur as a result of thisanalysis. Individuals should consult with their personal financial advisors.
Austin Galt Archive |
© 2005-2018 http://www.MarketOracle.co.uk - The Market Oracle is a FREE Daily Financial Markets Analysis & Forecasting online publication.
