Silver's Valuable Insights Into the Upcoming PMs Rally / Commodities / Gold & Silver 2020

Theanalysis of the precious metals market isn’t just goldanalysis – there are times when silver rises to the forefront ofeveryone’s attention. And we fully expect such a moment of the white metalstealing the spotlight to arrive shortly. What lessons can we draw from the silverchart?
Thekey analogy in silver (in addition to the situation being similar to mid-90s)continues to be the one between 2008 and the 2016 – now periods.
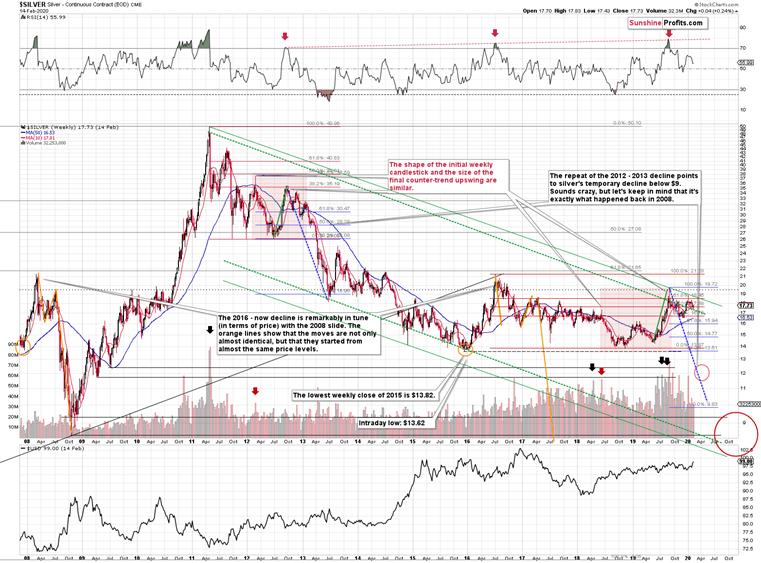
Thereis no meaningful link in case of time, or shape of the price moves, but if weconsider the starting and ending points of the price moves that we saw in bothcases, the link becomes obvious and very important. And price patterns in manymarkets tend to repeat themselves to a considerable extent. Sometimes directly,and sometimes proportionately.
Therallies that led to the 2008 and 2016 tops started at about $14 and we markedthem both with orange ellipses. Then both rallies ended at about $21. Then theyboth declined to about $16. Then they both rallied by about $3. The 2008 topwas a bit higher as it started from a bit higher level. And it was from thesetops (the mid-2008 top and the early 2017 top) that silver started its finaldecline.
In2008, silver kept on declining until it moved below $9. Right now, silver’smedium-term downtrend is still underway. If it’s not clear that silver remainsin a downtrend, please note that the bottoms that are analogous to bottoms thatgold recently reached, are the ones from late 2011 – at about $27. Silvertopped close to $20.
Thewhite metal hasn’t completed the decline below $9 yet, and at the same time itdidn’t move above $19 - $21, which would invalidate the analogy. This meansthat the decline below $10, perhaps even below $9 is still underway.
Naturally,the implications for the following months are bearish.
Let’sconsider one more similarity in the case of silver. The 2012 and the 2018 –today performance are relatively similar, and we marked them with redrectangles. They both started with a clear reversal and a steady decline. Thensilver bottomed in a multi-bottom fashion, and rallied. This time, silver movedabove its initial high, but the size of the rally that took it to the local top(green line) was practically identical as the one that we saw in the secondhalf of 2012.
Thedecline that silver started in late 2012 was the biggest decline in many years,but in its early part it was not clear that it’s a decline at all. Similarly towhat we see now, silver moved back and forth with lower highs and lower lows,but people were quite optimistic overall, especially that they had previouslyseen silver at much higher prices (at about $50 and at about $20,respectively).
The2012 corrective upswings were actually the final chances to exit long positionsand enter short ones. It wasn’t easy to do it back then just as it’s not easyto do so right now. But the size of the decline that followed speaks foritself. In investing and trading,what’s pleasant and what’s profitable is rarely the same thing.
Silver’shuge early-January reversal confirms gold’s reversal. Silver’s volume didn’tset a new record, but it was truly big nonetheless. Definitely more than enoughto make silver’s reversal important and reliable. It’s very bearish on its ownand extremely bearish when examined together with gold’s reversal.
Silverhas been very volatile recently, but the overalltendency for silver to outperform gold and mining stocks in thefinal part of a given rally remains intact. This means that if the preciousmetals sector is to rally for the next week or so, silver is likely to rallyvisibly.
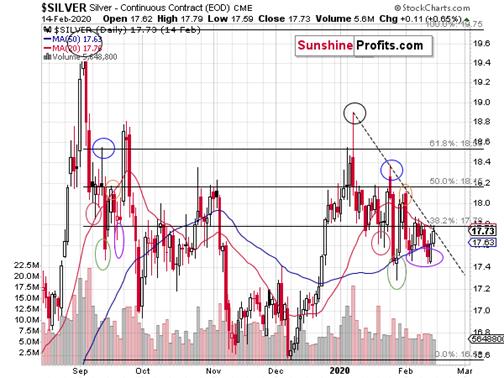
Thereis something interesting on its chart that we would like to share with you.Namely, silver’s performance so far this year resembles the way silver behavedafter the early-September 2019 top.
Wemarked the analogous price extremes with ellipses of the same color. The topsare in black, the initial lows are in red, the first corrective highs are inblue, then the lowest short-term lows are in green, then the next correctivehighs are in orange, and then the final short-term lows are in purple.
Ifthe similarity is to persist, silver is likely to rally particularly well thisweek.
Thisis especially the case, given silver’s intraday breakout above the declining dashed resistance line that you can see on theabove chart.
Justas gold broke above its resistance line, silver did the same thing above adifferent line. The implications are very bullish for the short term. Themarket just confirmed our decision to advantageously adjust the profit-takelevels in silver – and our subscribers already know what that means precisely.
Thankyou for reading the above free analysis. It’s part of today’s extensive Gold& Silver Trading Alert. We encourage you to sign up for our free goldnewsletter – as soon as you do, you'll get 7 days of free access to our premiumdaily Gold & Silver Trading Alerts and you can read the full version of theabove analysis right away. Signup for our free gold newsletter today!
Thank you.
Przemyslaw Radomski, CFA
Founder, Editor-in-chief
Toolsfor Effective Gold & Silver Investments - SunshineProfits.com
Tools für EffektivesGold- und Silber-Investment - SunshineProfits.DE
* * * * *
About Sunshine Profits
SunshineProfits enables anyone to forecast market changes with a level of accuracy thatwas once only available to closed-door institutions. It provides free trialaccess to its best investment tools (including lists of best gold stocks and best silver stocks),proprietary gold & silver indicators, buy & sell signals, weekly newsletter, and more. Seeing is believing.
Disclaimer
All essays, research and information found aboverepresent analyses and opinions of Przemyslaw Radomski, CFA and SunshineProfits' associates only. As such, it may prove wrong and be a subject tochange without notice. Opinions and analyses were based on data available toauthors of respective essays at the time of writing. Although the informationprovided above is based on careful research and sources that are believed to beaccurate, Przemyslaw Radomski, CFA and his associates do not guarantee theaccuracy or thoroughness of the data or information reported. The opinionspublished above are neither an offer nor a recommendation to purchase or sell anysecurities. Mr. Radomski is not a Registered Securities Advisor. By readingPrzemyslaw Radomski's, CFA reports you fully agree that he will not be heldresponsible or liable for any decisions you make regarding any informationprovided in these reports. Investing, trading and speculation in any financialmarkets may involve high risk of loss. Przemyslaw Radomski, CFA, SunshineProfits' employees and affiliates as well as members of their families may havea short or long position in any securities, including those mentioned in any ofthe reports or essays, and may make additional purchases and/or sales of thosesecurities without notice.
Przemyslaw Radomski Archive |
© 2005-2019 http://www.MarketOracle.co.uk - The Market Oracle is a FREE Daily Financial Markets Analysis & Forecasting online publication.