Silver, silver, and silver! There's More Than Silver, People! / Commodities / Gold and Silver 2018

 Silver,silver, and silver – that’s all there seems to matter to the more short-termoriented investors. But, there’s so much more that’s going on than just therally in the white metal that just got invalidated! The dynamics in theprecious metals market extend well beyond the above and the signal that’scoming from silver – as important as it is for the short run – is just one ofmany puzzles that create the entire precious metals picture. In today’sanalysis, we’ll discuss the less popular, but still important factors that areworth considering whether one is investing in gold, silver or mining stocks, orjust considering it.
Thisarticle is based on numerous questions that we received in the past severaldays from our subscribers. It’s quite likely that theyrepresent the questions and doubts of many other gold and silver investors, sowe thought that you’d appreciate getting to know replies and insights fromthose, who’ve been investigating this exciting and promising market for morethan a decade. Let’s move right to them.
Q: Does your analysis take intoaccount global gold and silver ETF holdings and additions?
A:Yes, we analyzed this issue and we found that the moves in the ETF holdings are the result – not the causeof moves in the price of gold. For instance, just because the GLD ETF addeda billion dollars in new money doesn’t make the outlook any more bullish thanknowing that the price of gold increased.
Isan increase in price always bullish? No. For instance, a rally on very lowvolume is bearish and the same goes forsilver’s quick outperformance. Also, please note that one wants to sellclose to the tops, not bottoms and tops are formed after the price increases.Were the GLD ETF flows tiny before the 2011 top? Of course not.
Eitherway, that’s why we don’t cover the ETF inflows and outflows on a regular basis.You can read a detailed analysis along with a very informative chart in our April15, 2016 article.
Q: Does your analysis take intoaccount silver / gold backwardation inthe futures market?
A:As it is the case with ETF holdings, weinvestigated this issue and – again – we found nothingextraordinary. As serious as this issue may appear at first sight, it seemsthat “backwardation” and “contango” are words that goldpromoters use to scare people and make it appear that the precious metalsmarket is going to explode immediately, and thus either sell more bullioninventory or make people sign up for services that are perma-bullish towardgold. Before you ask, we are not perma-gold-bears as we expect gold and silverto soar in the coming years and to move above their 2011 highs and we had beenbullish on gold for the long term until April of 2013 – you will find detailson thischart.
Q: In your analysis, do youconsider option expirations dates,close to delivery months?
A:Yes, that’s what we included in one of our investment tools – TrueSeasonals.That’s seasonality that’s enriched with the effect of the expiration dates offutures, options, and stock options. You will find the True Seasonal patternsfor this quarter on the following chart.
Sofar, the current quarter’s performance is in tune with the True Seasonalpattern. Please note that these patterns work best when there are no strongtendencies in the market and the long-term underperformance of mining stocksand the situation in the currency market suggests that there is a very bigchance for the PM sector to move lower – that’s not something that evenenriched seasonality should be able to change.
Q: While miners have underperformedfor some time, can it be that miners arestarting to play catch up, particularly since gold and silver prices havebeen fairly stable for the past month while the USD has also remained fairlystable?
A:It could be the case, but it’s not likely the case.
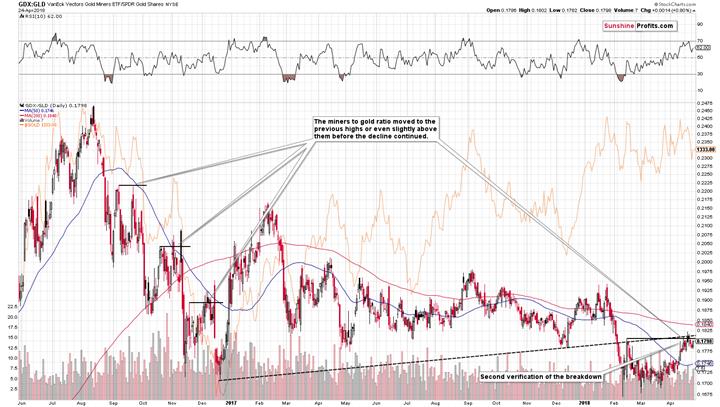
There’snothing special about the recent upswing in the ratio between mining stocks andgold. Theratio did move to the mid-February high, which does indeed appear to be a signof strength. But is this really a bullish development? As is usually the case,the context provides the key details.
Wealready wrote multiple times that during the previous big decline, the GDXmoved to its previous local high before continuing to move lower.
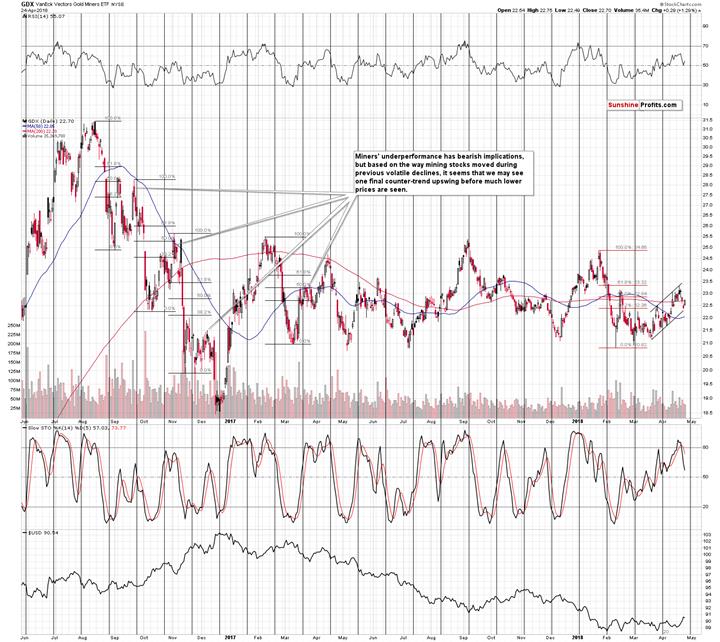
Thiscomment is still visible on the above GDX ETF chart. The point is that thiskind of performance was not only seen in the GDX – it was also seen in the caseof the GDX to gold ratio.
Wemarked the previous highs and the resistance that it created with short,horizontal black lines. In the first case, the miners reversed right aftertouching it briefly (just as we saw on Friday) and in the last two cases,miners moved slightly above it only to decline back below it shortlythereafter. That’s what we saw at the beginning of November 2016 and inDecember. The early November was the time when gold formed a major top and thecase in December was followed by a decline in gold.
Moreover,from the purely technical point of view, this month’s upswing in the ratiowas simply another verification of the breakdown below themedium-term resistance line based on the 2016 and late-2017 bottoms. Thebreakdown was not invalidated, so its implications remain bearish.
Therefore,can we say that the implications of the recent move higher in the GDX to goldratio really have bullish implications? Not at all.
Q: Unlike years past miners are generating positive free cashflow does this factor into your analysis?
A:It actually confirms it. Positive free cash flows are definitely positive newsthat should generate medium-term strength. The emphasis is on medium term, asthat’s not short-term or temporary news that could drive the prices higher fora day or two. We are not only not seeing this strength in the medium term, butwe are actually seeing mining stocks underperforming gold. The fact that theyunderperform even despite positive free cash flows makes the underperformanceeven clearer and even more bearish.
Q: With prices of all commoditiesincreasing could gold and silver beanticipating future inflation?
A:Good question. Indeed, gold is believed to be a hedge against inflation, which isnot the full truth. The price of the yellow metal is also viewed as anindicator of inflationary pressures. And indeed, the chart below seems topartially confirms this thesis (notice the 2009-2011 period).
However,the correlation is far from being perfect. The decline in gold prices in2011-2015 can hardly be explained by inflationary expectations. We believethat, at the moment, gold prices rather reflect a weak U.S. dollar. With astronger greenback, the price of the yellow metal would be lower, despite acertain rebound in inflation. Gold shines most brightly during high and acceleratinginflation - and we are not yet at this point. Inflation could rise this year,but it will most likely not get out of control.
Q: Is the back and forth inminers and PM simply a reflection ofglobal uncertainty?
A:Most likely not. The precious metals sector should theoretically rally inuncertain times and has not so far – even though the USD moved to new lows,gold didn’t move to new highs and miners are underperforming.
Wewere also asked to comment on the dynamics in the juniors to gold ratio.
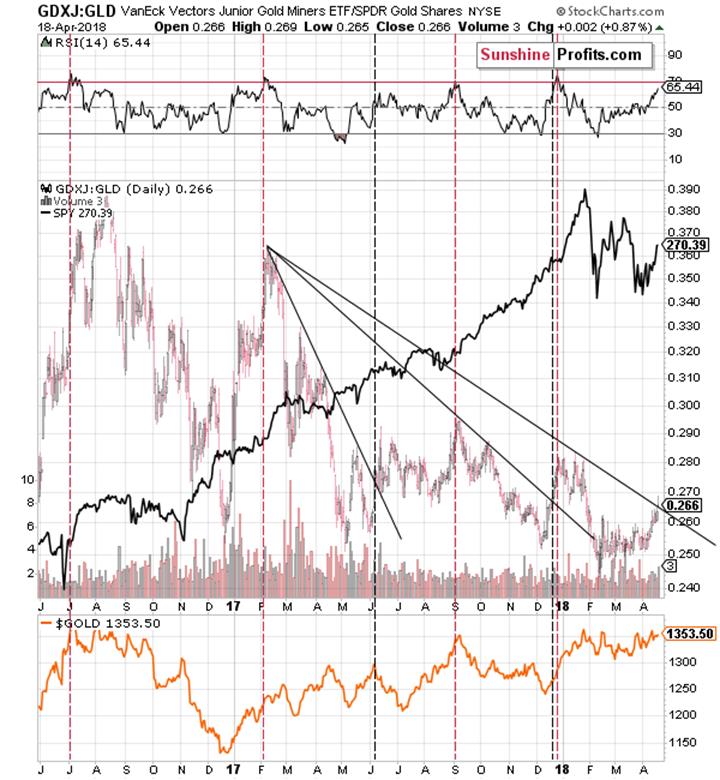
GDXJ toGold Ratio
Inparticular, we were asked to comment on the following quote:
“GDXJhas strongly outperformed Gold over the past seven trading days. The GDXJ toGold ratio has reached its highest mark since the start of February. Thatsudden relative strength is significant considering Gold is within spittingdistance of a major breakout” according to ETF Daily News.
Firstof all, it seems better to use GLD than gold for comparison in order to makesure that the price moves are indeed comparable. The same data source and thesame market ensure comparable closing prices.
Whenwe first read that question, we were surprised. “How did we miss that” was theinitial comment. The reason is that GDXJ:GDX and GDXJ:SPY are the two chartsthat we’re looking at on a daily basis ever since we researched them years ago.At times, they provide interesting anomalies, but it’s not the case very often(usually no more than a few times per year). The only reason that we were notfollowing the GDXJ:GLD ratio is that we didn’t find anything exceptional in itthat would add value to what we are monitoring through the GDX:GLD and GDX:SPYratio. So, either we missed something, or the ETF Daily News analyst(s) is/areexcited over something that is not really exciting. Or there was some kind ofnew development that we hadn’t seen previously. Either way, it’s worthre-examining the situation.
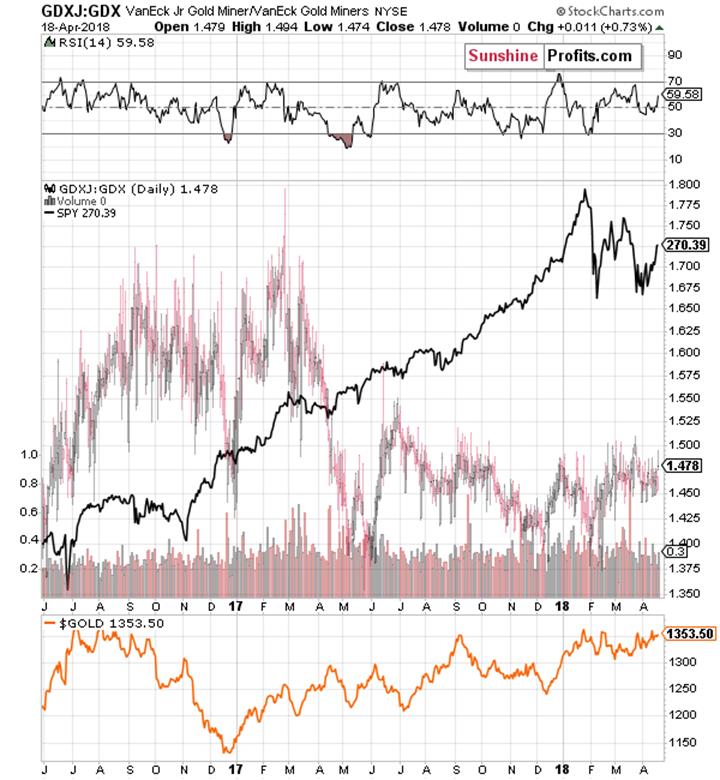
Thejuniors (GDXJ) to seniors (GDX) ratio has been moving back and forth in the tradingrange between 1.375 and 1.550 since mid-2017. The recent price move didn’t makethe ratio move to new highs, it was very ordinary. The ratio has indeed movedhigher from the beginning of February, but that doesn’t seem to have anyimplications. It also moved higher from December 2017 to early January 2018 andit didn’t cause any changes in the price of gold. There were other rallies inthe ratio and they didn’t really result in anything specific – the outcomesvaried. Is this bullish? Not really, especially if you factor in the fact thatthe biggest rally in the ratio (in mid-2016) preceded the biggest decline ingold that we’ve seen in the recent years.
TheRSI indicator doesn’t show anything special about the current situation either.
Ok, but the question was aboutthe GDXJ to gold ratio, not the one between GDXJ and GDX.
Atfirst sight there seems to be nothing special about the above chart – the rallythat we recently saw is in tune with the previous rallies (actually, a bitsmaller). The problem is that these rallies were followed by different pricebehavior in gold – just like what we saw on the previous chart. For instance,from November 2016 to December 2016, the ratio rallied while gold declined.
But the ratio is breaking abovethe declining black resistance line!
That’strue, but it broke above analogous declining black resistance lines alreadytwice in the recent past and we marked those cases with vertical black dashedlines. In one case the breakout took place at gold’s top (June 2017) and in theother case, the breakout took place during gold’s rally (December 2017).Therefore, there is no clarity regarding how we should interpret the recentbreakout and thus it’s not a reliable signal. It doesn’t seem to help in predicting gold prices at all.
But the RSI is moving toward 70 –it’s showing strength!
Again,it’s true, but it doesn’t imply anything. We marked cases when the RSI based onthe ratio was moving to or above 70 and there were 4 such cases. In 2 cases,gold topped at that time, and in 2 cases gold continued to move higher. That’sexactly the opposite of the performance that we would like to see in a signal.Gold could be topping, but it could also rally further – this signal doesn’tseem to tell us anything reliable.
Summary
Summingup, investing in and trading the precious metals market is much more difficultthan it appears at first sight as some of the mechanics are counterintuitive.Soaring and outperforming silver seems bullish, but it really isn’t. Positivefree cash flows that mining stocks generate seem bullish at first sight, butwhen compared to the actual price moves of the mining shares, they become abearish factor, and implications of rallying junior miningstocks are actually nonexistent even though higher prices seem quite promising.
It’seasy to get carried away be emotions when volatility spikes, but if one wantsto make serious profits in any market, including the precious metals market,the key trading tip that one needs to keep in mind is to make sure that onefollows cold logic when making investment decisions, not emotions. The stoicapproach to investing is likely to pay off with both peace of mind and sizablereturns. In this case, looking at thebig picture and considering many factors should prove much more beneficial thantrying to catch the silver market during its volatile upswing.
Please note that the above is based on the data thatwas available when this essay was published, and we might change our views onthe market in the following weeks. If you’d like to stay updated on ourthoughts on the precious metals market, please subscribe to our Gold & Silver Trading Alerts.
Thank you.
Przemyslaw Radomski, CFA
Founder, Editor-in-chief
Toolsfor Effective Gold & Silver Investments - SunshineProfits.com
Tools für EffektivesGold- und Silber-Investment - SunshineProfits.DE
* * * * *
About Sunshine Profits
SunshineProfits enables anyone to forecast market changes with a level of accuracy thatwas once only available to closed-door institutions. It provides free trialaccess to its best investment tools (including lists of best gold stocks and best silver stocks),proprietary gold & silver indicators, buy & sell signals, weekly newsletter, and more. Seeing is believing.
Disclaimer
All essays, research and information found aboverepresent analyses and opinions of Przemyslaw Radomski, CFA and SunshineProfits' associates only. As such, it may prove wrong and be a subject tochange without notice. Opinions and analyses were based on data available toauthors of respective essays at the time of writing. Although the informationprovided above is based on careful research and sources that are believed to beaccurate, Przemyslaw Radomski, CFA and his associates do not guarantee theaccuracy or thoroughness of the data or information reported. The opinionspublished above are neither an offer nor a recommendation to purchase or sell anysecurities. Mr. Radomski is not a Registered Securities Advisor. By readingPrzemyslaw Radomski's, CFA reports you fully agree that he will not be heldresponsible or liable for any decisions you make regarding any informationprovided in these reports. Investing, trading and speculation in any financialmarkets may involve high risk of loss. Przemyslaw Radomski, CFA, SunshineProfits' employees and affiliates as well as members of their families may havea short or long position in any securities, including those mentioned in any ofthe reports or essays, and may make additional purchases and/or sales of thosesecurities without notice.
Przemyslaw Radomski Archive |
© 2005-2018 http://www.MarketOracle.co.uk - The Market Oracle is a FREE Daily Financial Markets Analysis & Forecasting online publication.