Silver Threatens To Defy Technical Levels Again
A drop to $13.86 in November was ugly.
A rise to $16.20 looked like a breakout was on the horizon.
Failure in early March.
Buying dips and selling rallies rather than looking for technical breaks.
USLV and DSLV for those who do not trade futures.
Silver can be a tricky metal when it comes to its price action. Silver looks like it is going to the moon on the way up, and when it declines, it seems like the price is on its way to zero. The precious metal has a long history as the most speculative member of its sector of the commodities market. Silver tends to move on sentiment, and the price action can be like a game of musical chairs. The price moves higher until the buying stops, and lower until the selling ends.
Since 1980 silver has made two journeys to the $50 level. In 1980, it rose just above and in 2011, it stopped just 18 cents shy of the market. The price of silver traded at under $10 per ounce from 1984 through 2006. From 1989 through 1995, the price never traded above $6. After the turn of the century and silver's ascent to the high at $49.82 in 2011, the price has not traded below $13.635, and below the $10 level in over a decade since 2008. The silver market can be a bucking bronco at times, and recent price action could be telling us that the market is getting ready to make a move.
The most direct route to participate in the volatile silver market is via the futures and futures option offered on the COMEX division of the CME. In the world of futures, a market participant controls an entire 5,000 contract of the metal for a percentage of the value called the original margin. Therefore, futures are a highly leveraged asset. For those who do not venture into the futures arena but still want to play silver with leverage, the Velocity Shares 3X Long Silver ETN product (USLV) and its bearish counterpart (DSLV) are short-term instruments that magnify the price action in the silver futures market.
There has been increasing volatility in the silver market since mid-November, and the price variance continues to offer trading opportunities for market participants who are looking for price action.
A drop to $13.86 in November was ugly
In August 2018, the price of gold fell to its lowest level since early 2017 at just over $1160 per ounce. However, the yellow metal did not challenge or come close to its critical technical support level at the December 2015 low at $1046.20. Silver was another story. 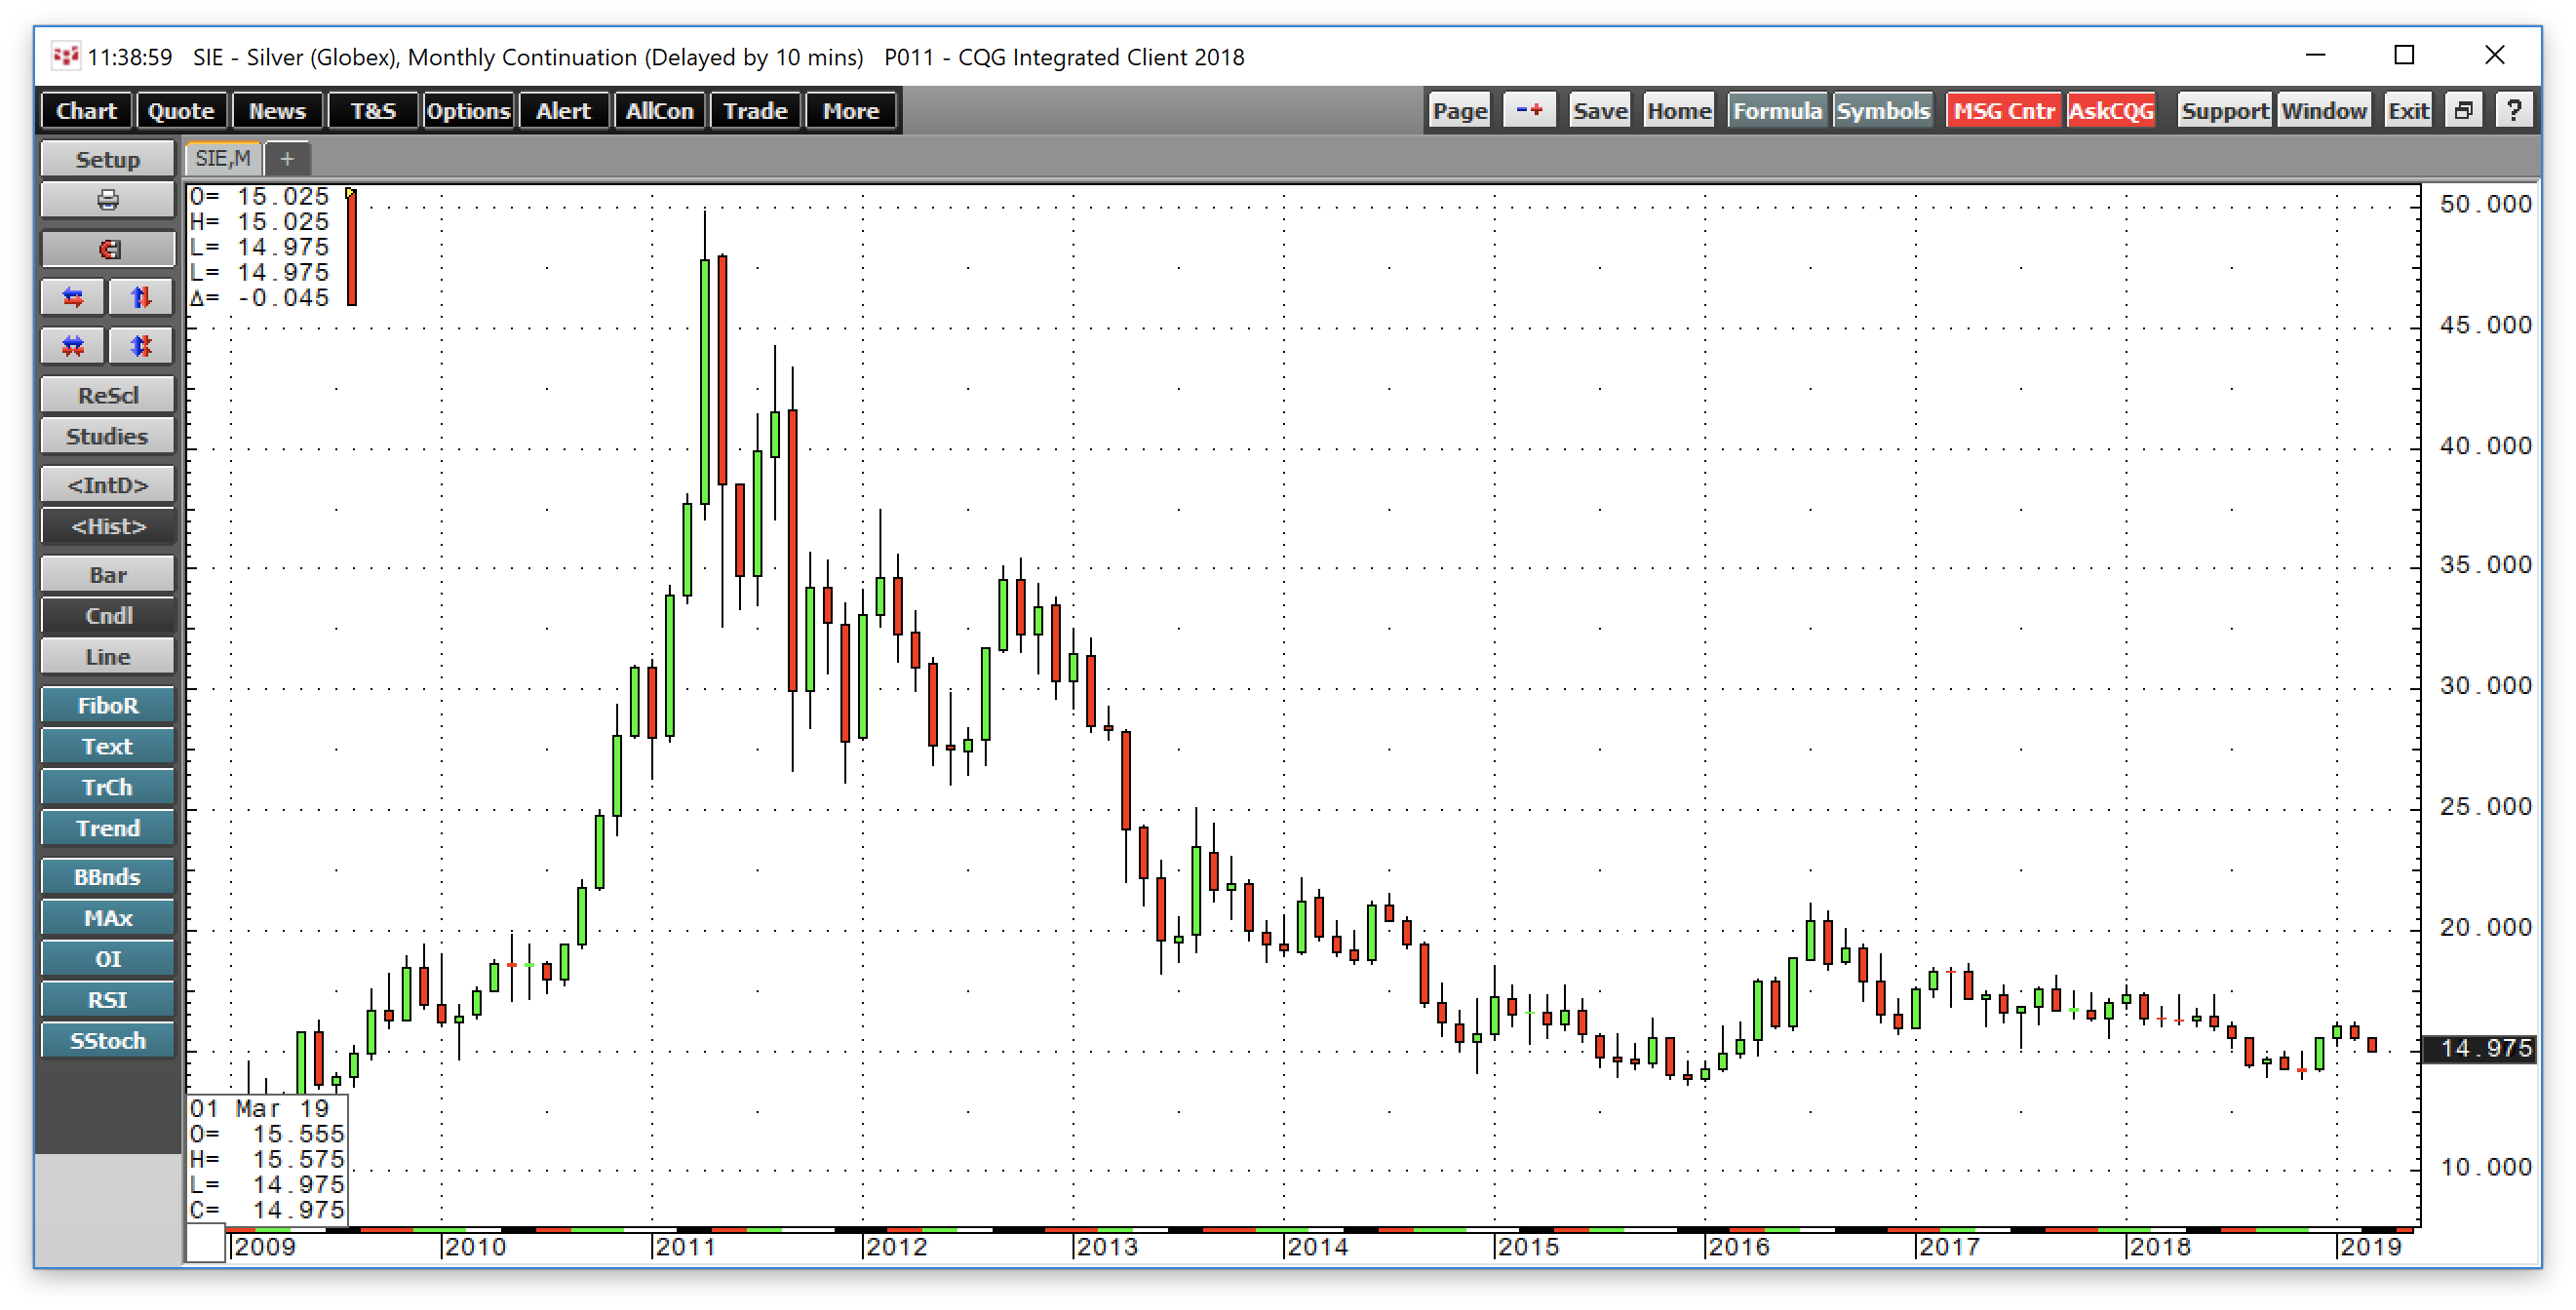
Source: CQG
As the monthly chart highlights, the COMEX silver futures fell to a low at $13.86 per ounce in mid-November 2018 even though the price of gold had recovered. The critical support level in the silver market also came at the December 2015 low, but silver came dangerously close to that level which stands at $13.635 late last year. Silver stopped falling just 22.5 cents above its technical level that is a line in the sand on the downside.
A rise to $16.20 looked like a breakout was on the horizon
After its scary trip to $13.86 in mid-November, silver futures took off to the upside. Six weeks later, the price rose to over $16 per ounce on the nearby COMEX futures contract. 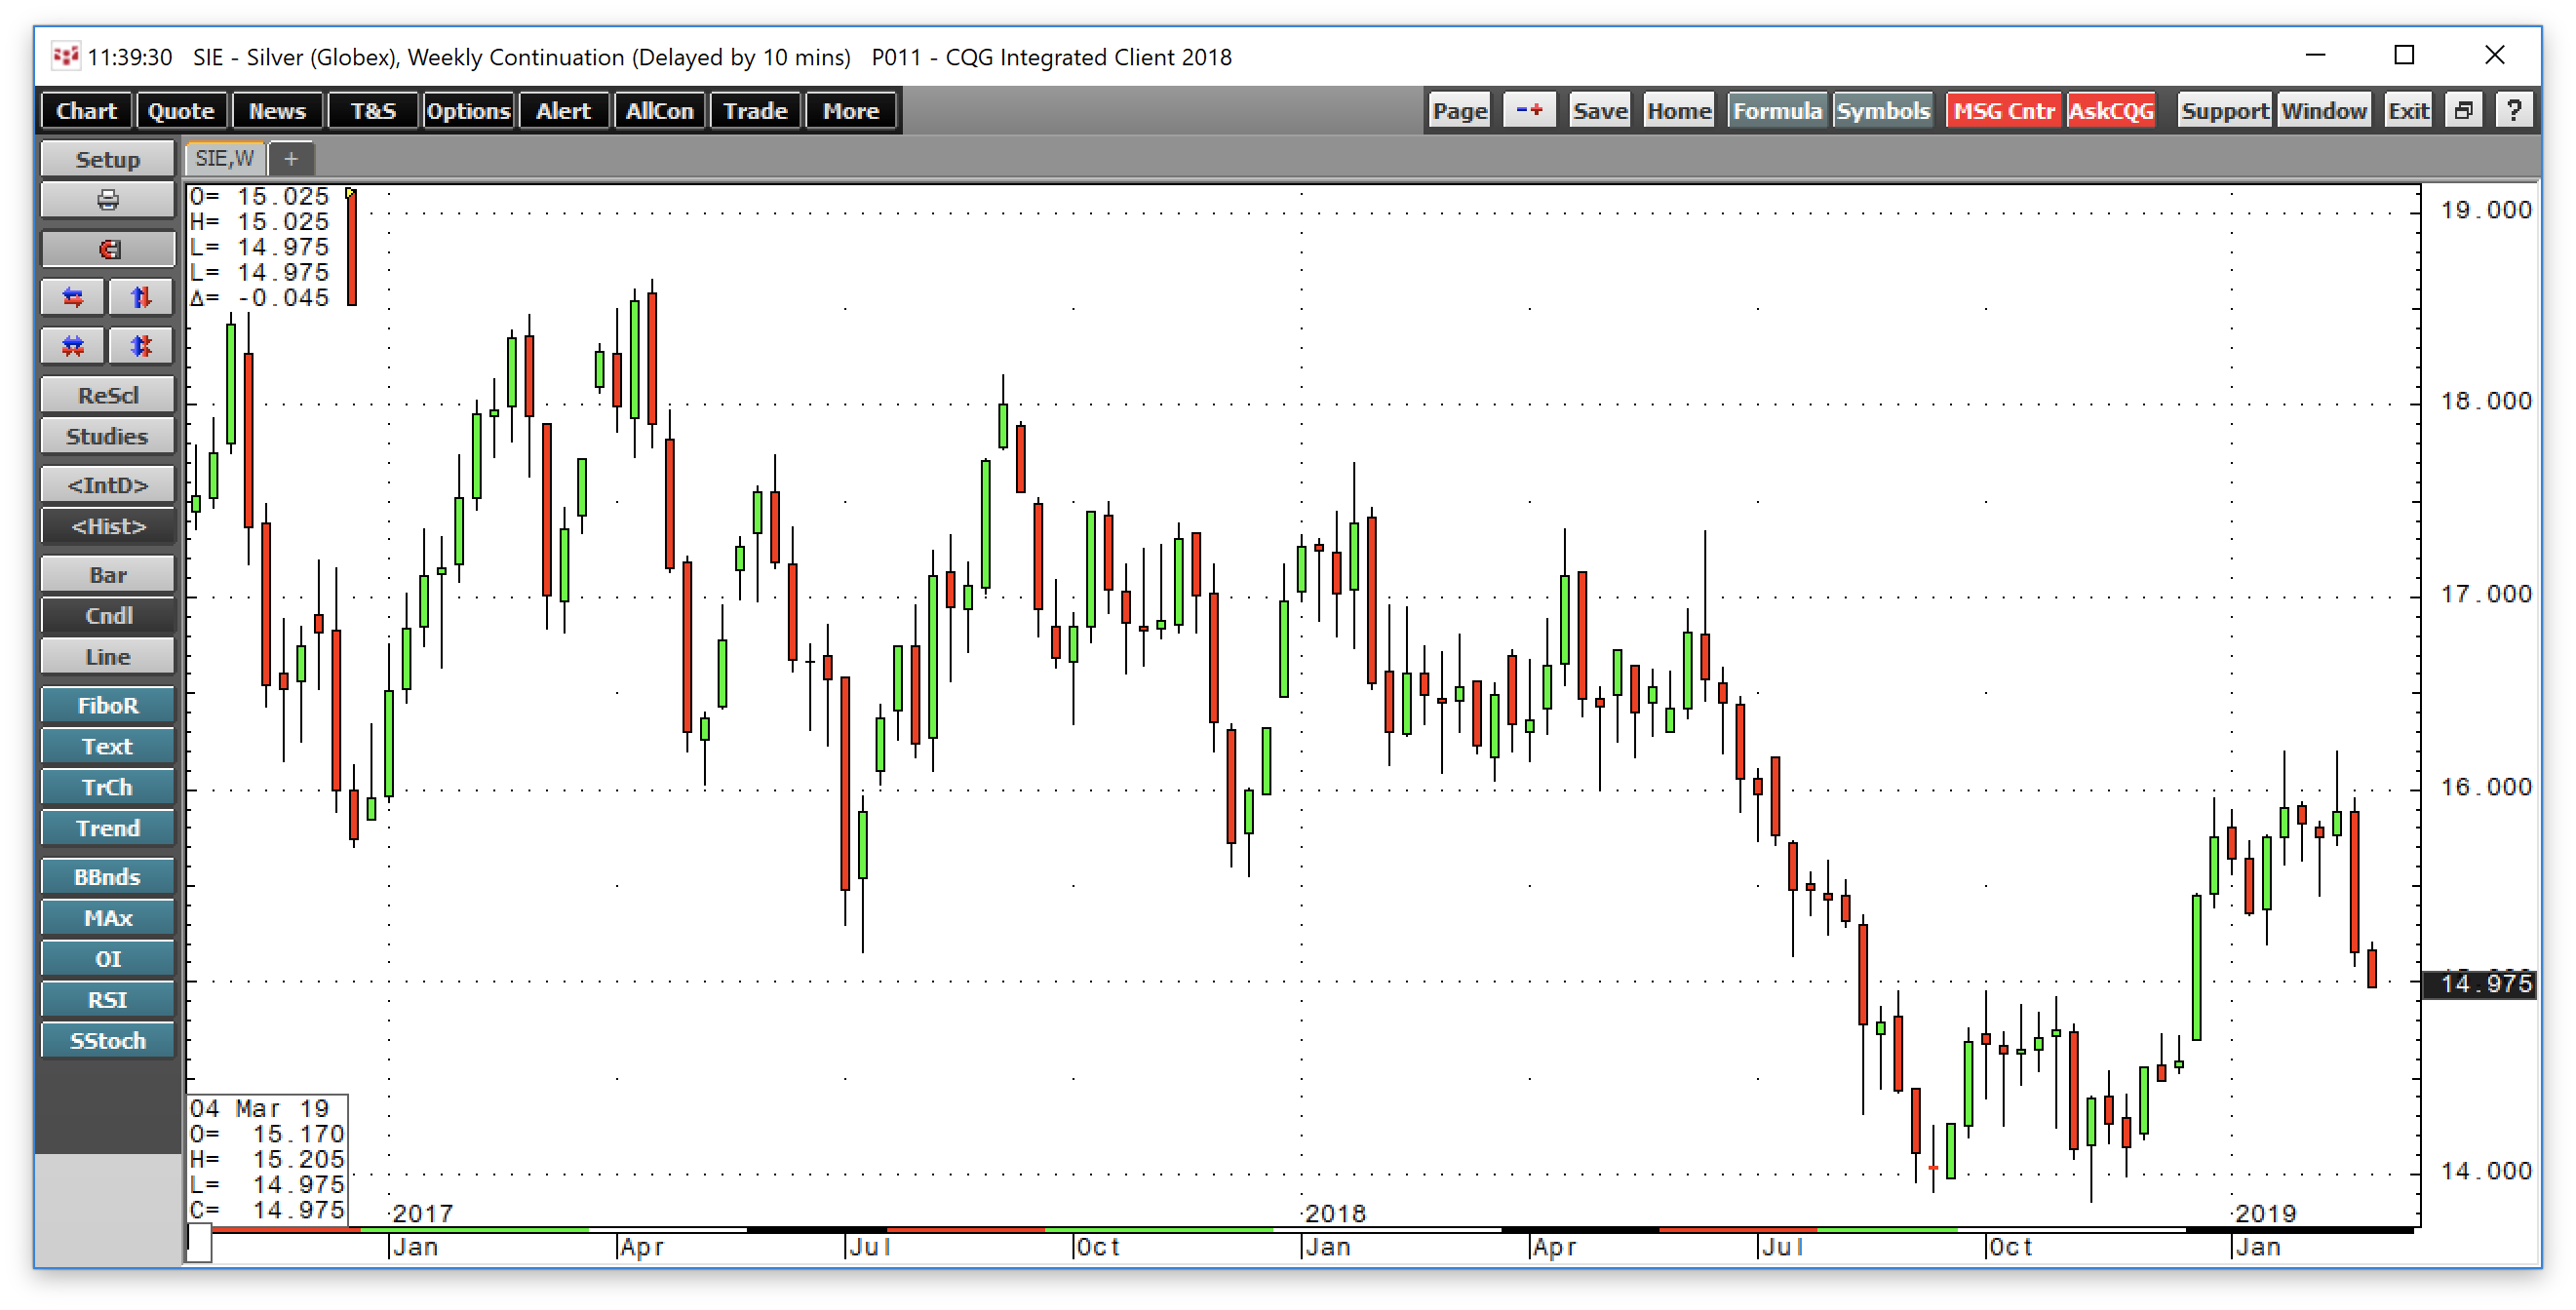
Source: CQG
As the weekly chart illustrates, silver rose to a peak at $16.20 during the final week of January, $2.34 or 16.9% above its November low. After another attempt to make a higher high on February 20, silver came within one-half cent of the peak when it traded to $16.195. The failure led the price to plunge at the end of February and into early March.
Failure in early March
The bottom fell out of the silver market after its failure to reach a higher high on February 20. 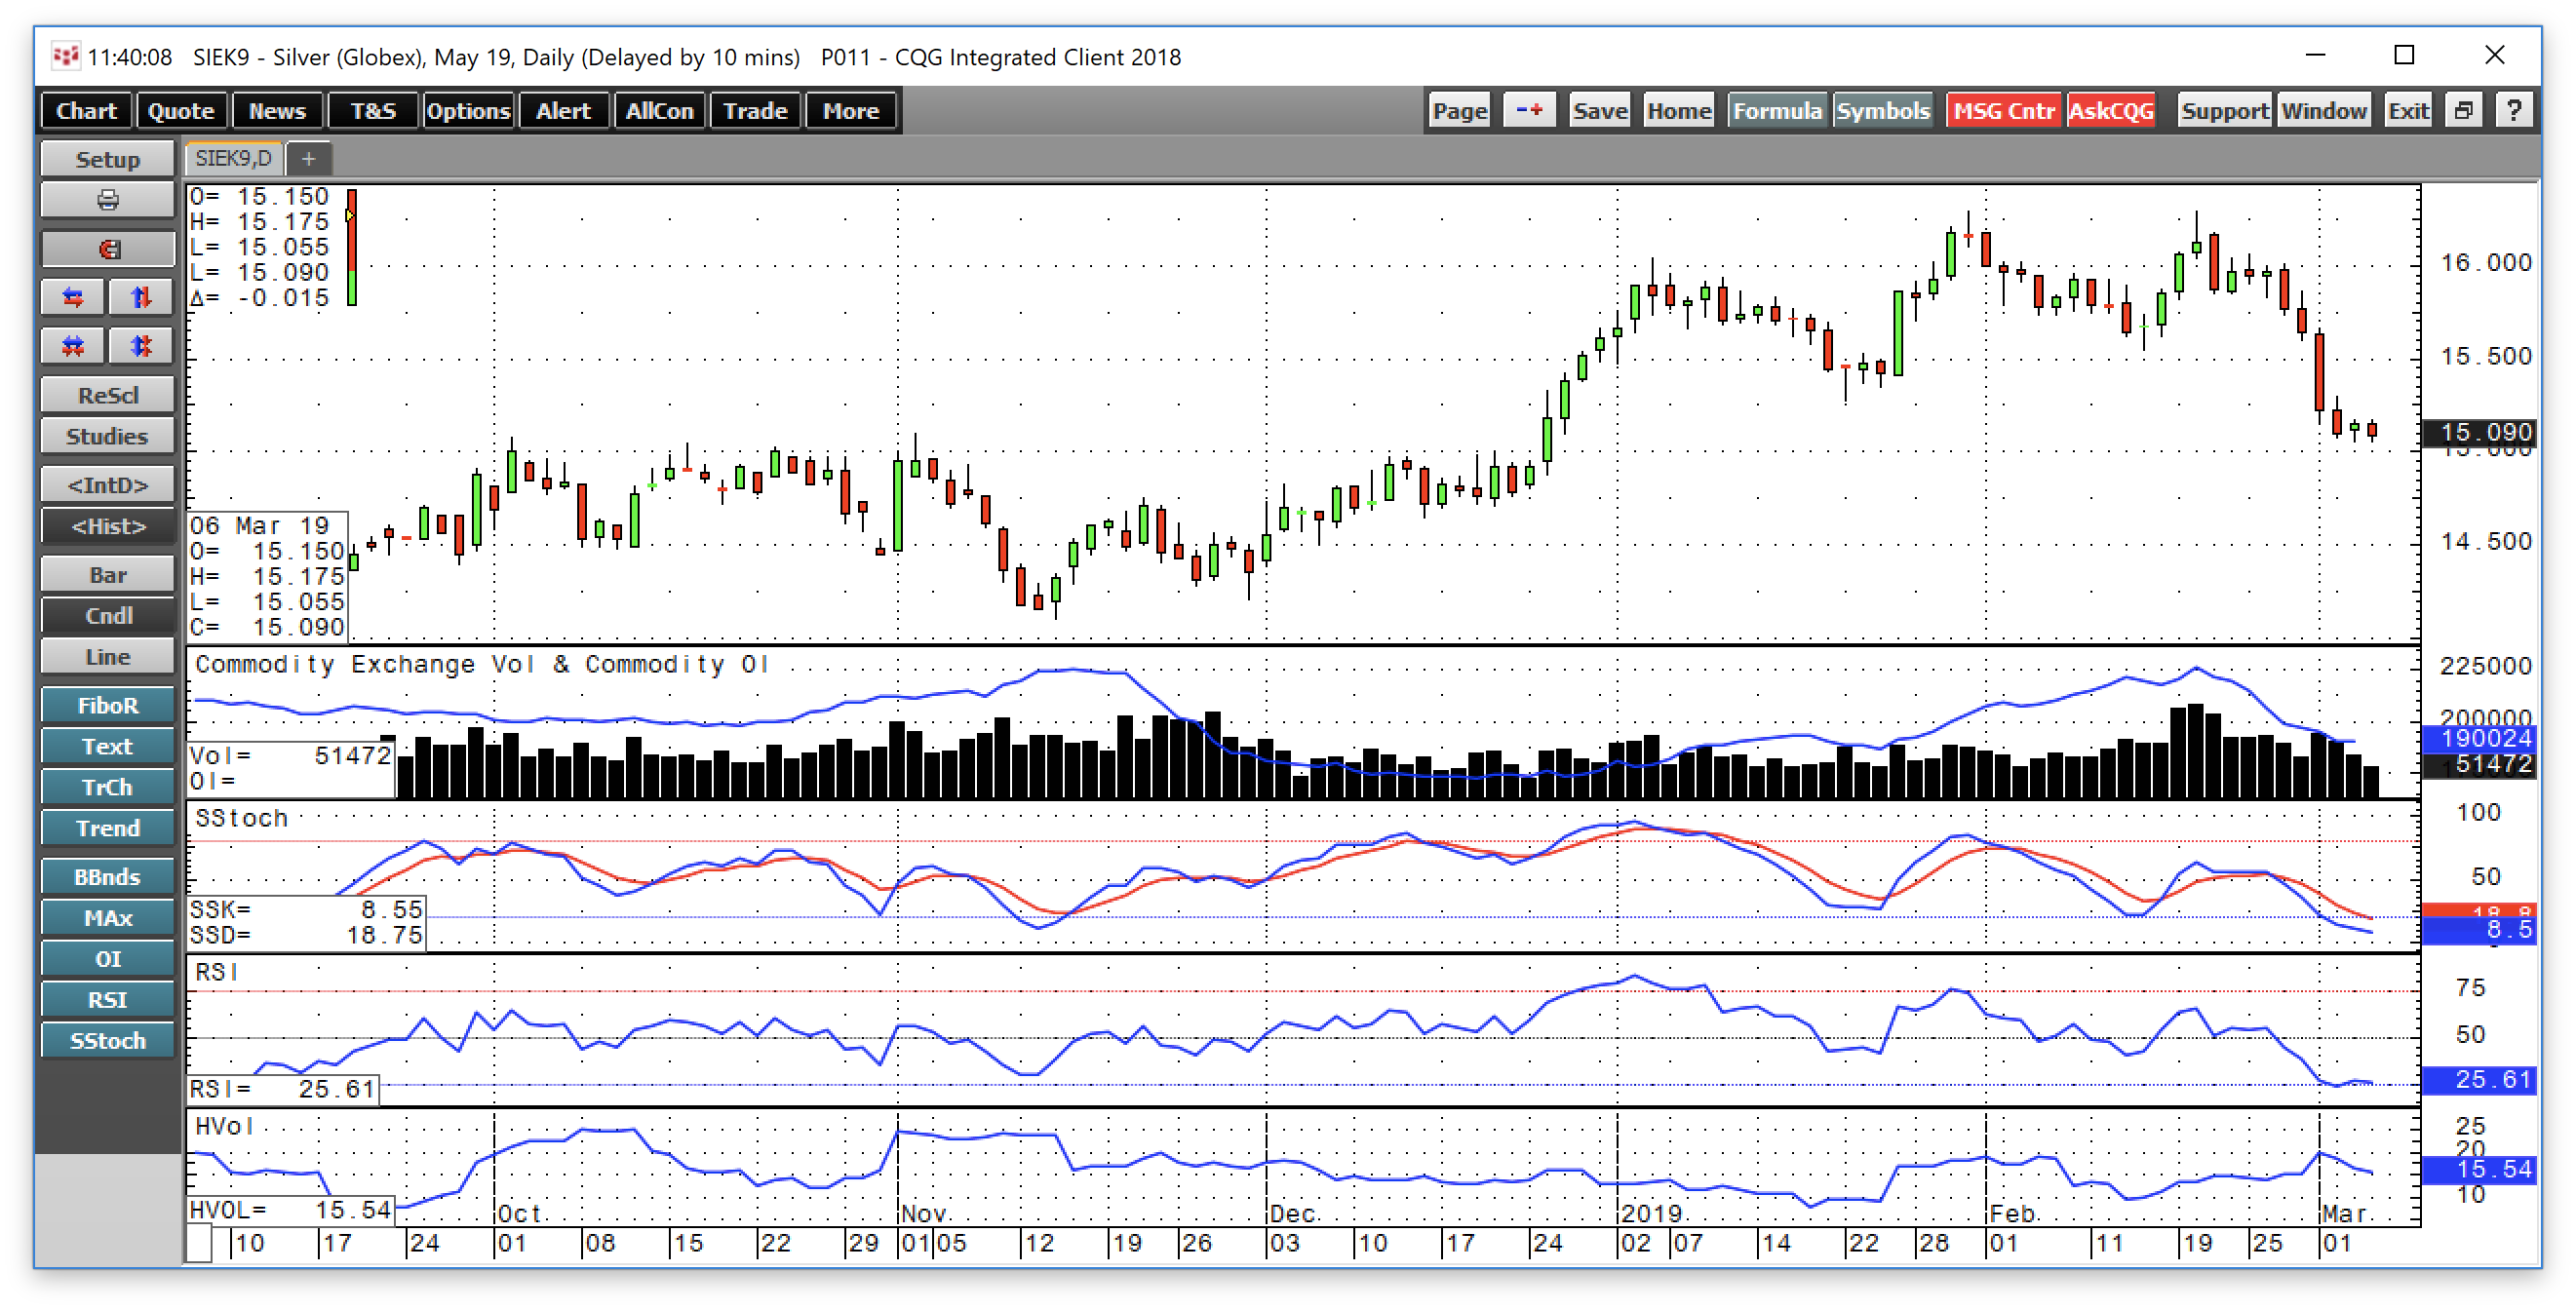
Source: CQG
As the daily chart of May futures shows, while silver made a lower low on February 20 on the continuous futures contract, it made a higher high on the May contract when it traded to $16.295, just to confuse matters.
After falling over four consecutive sessions, the price of May silver reached a low at $15.055 per ounce on March 6 which was a decline of 7.6% from the recent peak. The decline has led short-term price momentum and relative strength indicators to fall into oversold territory on the daily chart. Moreover, the move in open interest could shed light on the rally and decline in the silver market since December.
Open interest is the total number of open long and short positions in a futures market. In the silver market, the all-time high in the metric was at 243,411 contracts in April 2018. In 2018, the low was at 173,574 contracts in December. The silver market rallied when the metric reached its low, and it is possible that the rise to over 225,000 contracts on February 20 meant that the market became too long and overenthusiastic on the upside. Since the price decline started on February 21, the metric declined to the 190,000-contract level as of March 5 meaning that the drop in the price of silver cleaned weak longs from the market after its failure to make a higher high.
The critical technical level for the silver market on the upside stands at the June 2018 high at $17.35 per ounce. To break the pattern of lower highs and lower lows that has been in place since July 2016 when the volatile precious metal rose to $21.095 following the shock of the Brexit referendum, silver has traded in a bearish price pattern. It is likely that too many speculative longs hopped on board the silver train during the recovery that took it to over $16, and their scramble for an exit caused the most recent price correction and move to just over $15 per ounce on the May futures contract.
Buying dips and selling rallies rather than looking for technical breaks
Sentiment drives the price of silver, and the hopes for a challenge of the resistance level at $17.35 went up in smoke after silver failed at over $16 last month. However, now that open interest has declined, it is possible that the precious metal will find a higher low which could set the stage for another challenge of the 2019 peak at $16.20 in the coming weeks.
Silver is a tough metal to trade as it looks its best on the highs and worst on the lows. On March 6 as the price is at $15.055 per ounce, it looks like it is heading for much lower levels on the downside. Meanwhile, silver looks as bad at just over $15 as it looked set to explode at $16.20. While silver has broken out and made massive moves over history since 1980, the optimal approach to the silver market has been to sell the metal when it is at a level that would launch the price into the stratosphere and buy it when it appears it is on its way to zero. I have traded silver since 1981, and one of my fellow traders named his dog silver in a tribute to how difficult it is to trade the metal for anyone looking for a technical breakout.
USLV and DSLV for those who do not trade futures
While the most direct route to for trading or speculative positions in the silver market is via the COMEX futures and futures options, those who do not venture into the futures arena but still desire a significant amount of leverage have an alternative these days. The Velocity Shares 3X Long Silver ETN product ]and its bearish counterpart are tools that can satisfy an appetite for action in the silver market. The fund summary for USLV states:
The investment seeks to replicate, net of expenses, three times the S&P GSCI Silver index ER. The index comprises futures contracts on a single commodity. The fluctuations in the values of it are intended generally to correlate with changes in the price of silver in global markets.
USLV and DSLV are only appropriate for short-term forays into the silver market. The triple leverage comes at a price which is time decay. Both of these products on the long and short side suffer from periodic reverse splits and will decay over time becoming dust collectors in the portfolios of market participants who buy them for anything but a short-term trading position. Therefore, tight price and time stops are necessary for success when using the USLV and DSLV instruments. Silver rose by 16.9% from November to January.
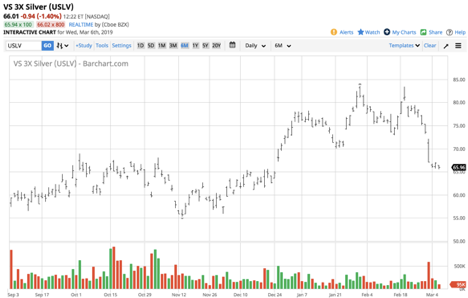
Source: Barchart
As the chart shows, over the same period, USLV rose from $55.31 to a high at $83.61 or 51.2% or triple the price move in the silver market. Since February 20, the price of May futures dropped from $16.295 to $15.055, a decline of 7.6%. 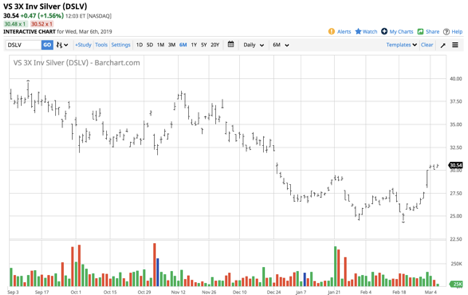
Source: Barchart
Over the same period, the bearish DSLV rose from $24.50 to a high at $30.64 or 25%, more than triple the percentage move in the May silver futures contract.
USLV and DSLV have net assets of $230.79 million and $27.77 million respectively. The difference in net assets reflects that the long side of the silver market tends to be a lot more popular with market participants than the short side. DSLV trades an average of 111,660 shares each day while around 200,000 shares of USLV change hand on an average session.
Silver has a habit of faking the market as it moves to highs and lows. I have found that watching open interest is a good guide to locating highs and lows. When the metric falls to near the 170,000 level, it often reverses, and at over 225,000 the market becomes oversaturated. Buying silver when it looks its worst and selling it when it seems poised for a moonshot has been the optimal strategy for years in the precious metal that moves on sentiment.
The Hecht Commodity Report is one of the most comprehensive commodities reports available today from the #2 ranked author in both commodities and precious metals. My weekly report covers the market movements of 20 different commodities and provides bullish, bearish and neutral calls; directional trading recommendations, and actionable ideas for traders. I just reworked the report to make it very actionable!
Disclosure: I/we have no positions in any stocks mentioned, and no plans to initiate any positions within the next 72 hours. I wrote this article myself, and it expresses my own opinions. I am not receiving compensation for it (other than from Seeking Alpha). I have no business relationship with any company whose stock is mentioned in this article.
Additional disclosure: The author always has positions in commodities markets in futures, options, ETF/ETN products, and commodity equities. These long and short positions tend to change on an intraday basis.
Follow Andrew Hecht and get email alerts