Some Optimistic Precious Metals Charts / Commodities / Gold & Silver 2019

 Below is a weekly chart for the GDX we’ve been following for a long time watching the two and a half year falling wedge completing about 8 weeks ago when we finally got the breakout. The backtest to the top rail took about seven weeks to complete with this weeks price action possibly beginning the impulse move higher. To be honest I still can’t rule out another backtest to the top rail and the 30 week ema, but at this point it appears the breaking out and backtesting process looks to be complete.
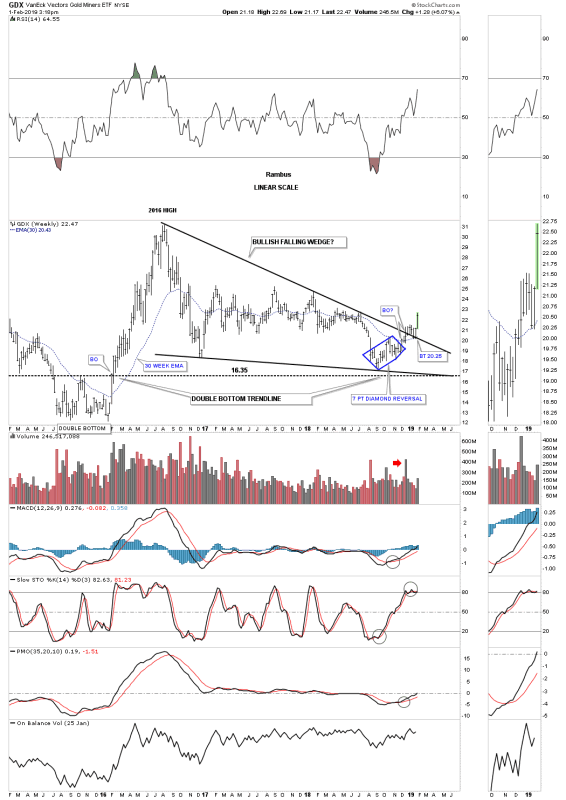
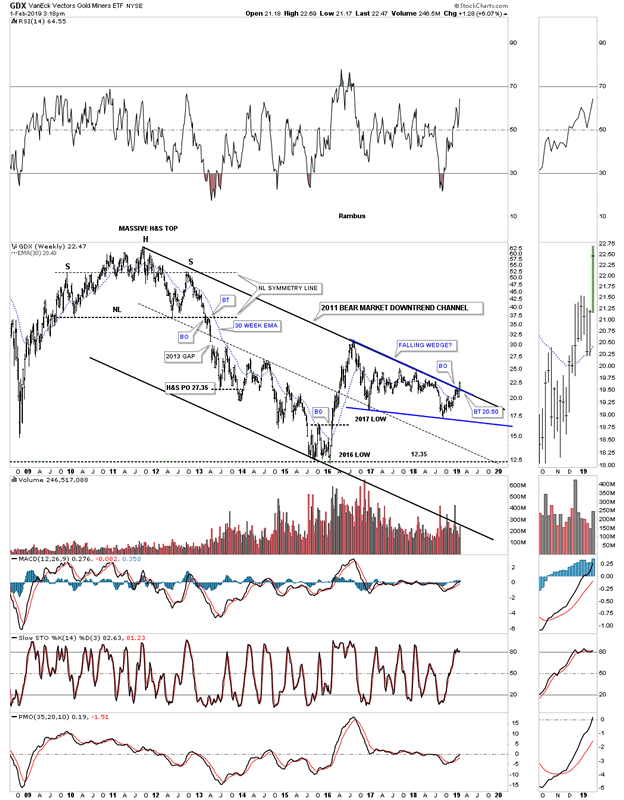
The only reason I can’t rule out a possible second backtest is because of the top rail of the 2011 bear market downtrend channel that was broken this week and could be backtested.
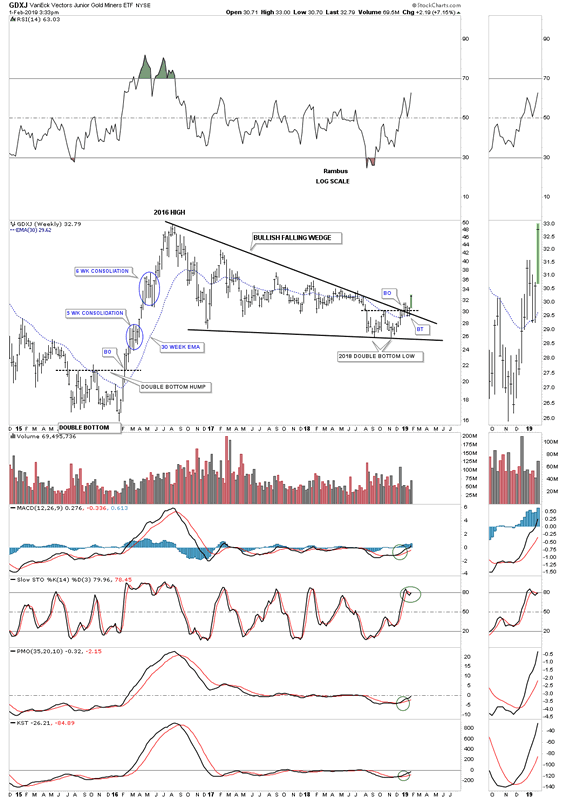
The GDXJ weekly breakout and backtest.
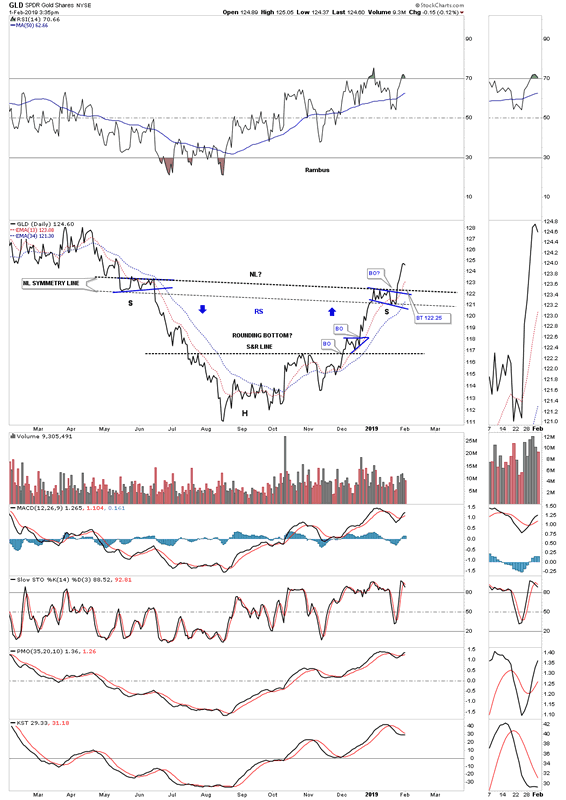
The daily line chart for GLD shows we could get a backtest to the neckline around the 122.25 area which would be perfectly normal and actually healthy for the longevity of this move.
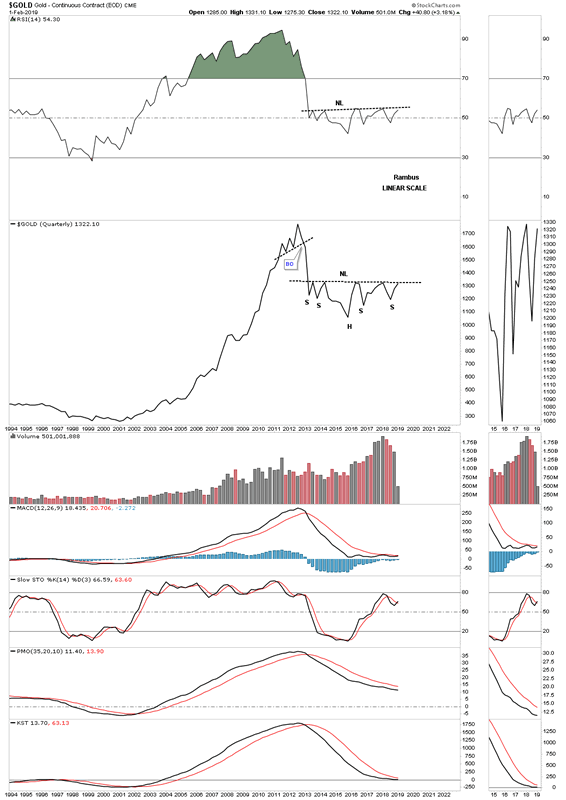
Last week I showed you a long term quarterly line chart for gold which is showing a possible very large H&S bottom that actually started building out during the 2013 crash. It’s another way to cut out the noise and look for big patterns. When you do spot a big pattern on a quarterly line chart you can then look at a monthly chart for more clarity and then fine tune it by looking at a weekly chart
Have a great Super Bowl Sunday.
All the best
By Rambus Chartology
FREE TRIAL - http://rambus1.com/?page_id=10
© 2019 Copyright Rambus- All Rights Reserved
Disclaimer: The above is a matter of opinion provided for general information purposes only and is not intended as investment advice. Information and analysis above are derived from sources and utilising methods believed to be reliable, but we cannot accept responsibility for any losses you may incur as a result of this analysis. Individuals should consult with their personal financial advisors.
© 2005-2019 http://www.MarketOracle.co.uk - The Market Oracle is a FREE Daily Financial Markets Analysis & Forecasting online publication.