The Bullish Message Of The Gold Stocks
Gold mining stocks are showing relative strength vs. gold and stocks.
This has bullish implications for gold's intermediate-term outlook.
Latest fears over Eurozone slowdown are also fueling gold demand.
The strongest gold bull markets have historically been characterized by three major factors. The first is a weak dollar, which serves to strengthen gold's currency component. The second is safety-related demand born of widespread fears among investors. A third factor is perhaps less widely known but is equally important: the strength and leadership of the publicly traded companies which mine the physical metal. After several months of lagging, gold mining stocks are starting to show impressive relative strength. We'll discuss this growing strength in today's report and discuss its bullish intermediate-term (3-9 month) implications for the gold price.
Gold's performance has been impressive lately, thanks largely to a wave of fears on the part of global investors. These fears encompass everything from worries over the state of the slowing Eurozone economy to the continued uncertainty over the U.S.-China trade war to the recent inversion of the U.S. Treasury yield curve.
The fact that the spread between the 3-month Treasury and the 10-year bond has turned negative for the first time since 2007 is partly a result of both the Fed's and the market's recognition that the Eurozone may be headed toward recession. The graph shown here illustrates the notable decline in the Eurozone Purchasing Managers' Index (PMI), which recently slid into negative territory for the first time in years.
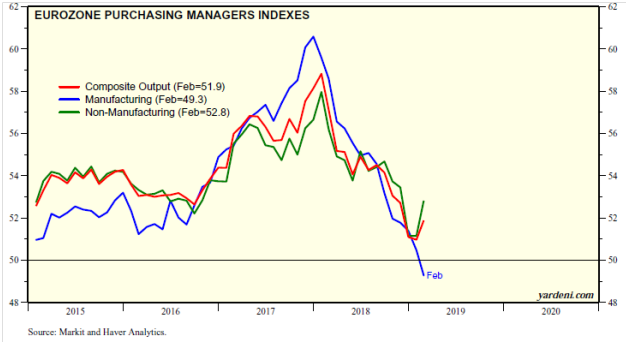 Source: Yardeni Research
Indeed, demand for U.S. government bonds and gold - historically two of the safe-haven assets - has soared in the last several days as investors worry about the soundness of Europe's economy. While U.S. Treasury bonds have recently outperformed gold, the yellow metal is nonetheless staging an impressive comeback after its late February pullback.
Gold's recent gains have come despite the stubborn resilience of the U.S. dollar index (DXY), which has remained near its highest level of the past year. Normally, a weaker dollar is required to boost gold prices due to gold's inverse correlation with the dollar. But the gold price is more than just a reflection of a weak dollar; it's just as much a result of safety-related demand. And, with investors' fears at fever pitch, investors have few alternatives to higher-risk equities. Consequently, gold and U.S. Treasuries are two of the top choices right now for flight capital.
Yet, despite investors' current aversion to risk, gold's relationship to the U.S. equity market isn't as strong as it was a few months ago when the gold rally first began. The following graph shows the relative strength of the gold price versus the benchmark S&P 500 Index (SPX). Here, you can see that while the Gold:SPX ratio is still well off its 2018 low, it's also well below its December 2018 high. Moreover, the ratio is currently under its 50-day moving average, which reflects a recent underperformance on gold's part compared with equities.
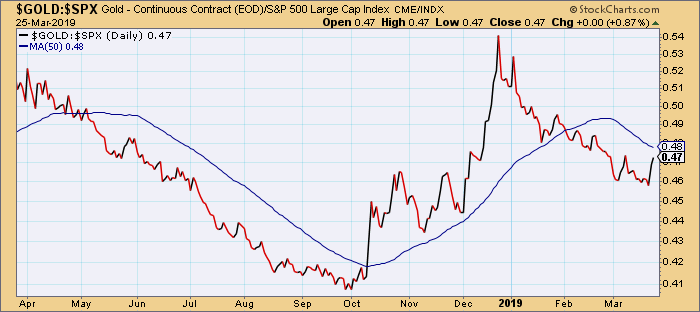 Source: StockCharts
This recent lag in gold's relative strength versus the SPX isn't a reason for abandoning the bullish case for the metal. It does, however, show that gold definitely has room for improvement, and it also partly accounts for gold's sluggish price trend for much of the past month. As I've emphasized in past reports, investment fund managers typically look at the relative relationship between stocks and gold before deciding to make serious commitments to the metal. When gold's relative strength performance versus the SPX is strong, fund managers are far more likely to purchase bullion or bullion-backed ETFs.
While gold's relative strength versus the S&P 500 could use some improvement, there is one measure of relative strength which bodes well for the metal. I'm referring to the relationship between the PHLX Gold/Silver Index (XAU) and the gold price itself. The XAU is considered by most participants as the benchmark index for measuring the aggregate performance of the major publicly traded gold exploration and mining companies. As the following chart shows, the XAU:Gold ratio has posted a strong performance in just the last few weeks. It shows that gold stocks are beginning to outperform the physical metal, and that's usually a bullish leading signal for the metal.
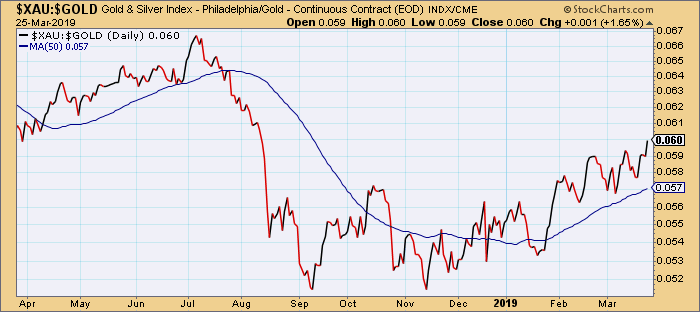 Source: StockCharts
Even more impressive is the fact that the XAU is significantly outperforming the S&P 500 Index on a short-term basis (below). This positive factor almost certainly won't be ignored by fund managers in their quest for above-average returns. It's also another reason for expecting gold to follow the lead of the gold miners in the coming weeks.
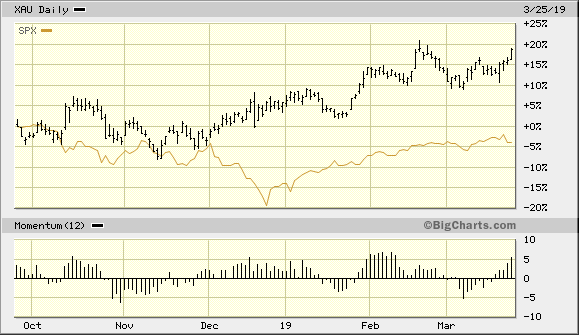 Source: BigCharts
Returning to gold's technical outlook, the most important consideration for gold is the near-term trend. The trend remains up as defined by the key short-term moving averages, namely the 15-day and 50-day moving averages. As the April 2019 gold futures chart shows, the gold price is well on its way to recovering all its losses from the pullback that started a month ago. I expect it to succeed in this attempt based on the recent acceleration of the market's fears over a global economic slowdown.
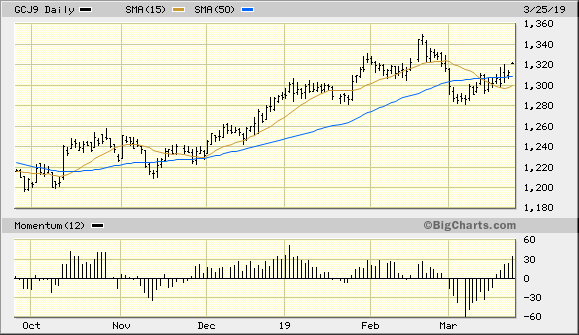
Source: BigCharts
On the ETF front, the iShares Gold Trust (NYSEARCA:IAU) recently confirmed another immediate-term (1-4 week) buy signal per the rules of my trading system. IAU closed above its nearest pivotal high of $12.56 on March 20 to confirm the latest bottom and re-entry signal. I recommend that traders who purchase IAU use a level slightly under $12.30 as the initial stop loss for this trade on an intraday basis. The gold ETF is finally starting to show some additional upside follow-through to last week's rally, which should give the bulls a more decisive advantage in the immediate term.
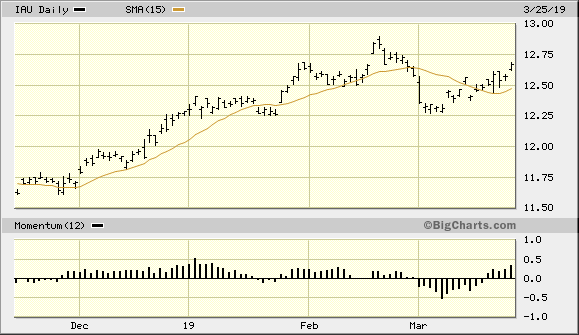
Source: BigCharts
While weakness in the U.S. dollar index would greatly assist gold's attempt to overcome its February price peak, this isn't necessary to ensure gold's continued recovery. As I've argued in this report, the latest increase in global economic fears, along with the U.S. Treasury yield curve inversion, supports a buoyant price for the yellow metal. Moreover, impressive strength in the actively traded gold mining shares also suggests that gold demand will further increase based on the historic relationship between the two asset categories. In summary, the weight of evidence remains positive for the yellow metal's short-term and intermediate-term outlook, and investors are therefore justified in maintaining a bullish outlook.
Disclosure: I am/we are long IAU. I wrote this article myself, and it expresses my own opinions. I am not receiving compensation for it (other than from Seeking Alpha). I have no business relationship with any company whose stock is mentioned in this article.
Follow Clif Droke and get email alerts