The Fed And Trade Boost Stocks - Gold Stocks Doing Well Since Mid-September
A new and improved stock market in 2019.
The Fed's change of heart provides support.
Gold has shined in 2019.
Gold stocks are outperforming the S&P 500 since mid-September.
Markets rarely move in a straight line.
On Wednesday, February 20, the US Federal Reserve released the minutes of the most recent Federal Market Open Committee meeting. In their statement that followed the meeting and the minutes that followed, the central bank pledged to monitor the data with patience when it comes to further short-term interest rate hikes. After four increases in the Fed Funds rate last year that took it one full percentage point higher, it appears that the Fed has completed its goal of tightening credit to a level that both promotes economic growth and prevents the economy from overheating, for now.
The minutes also contained information about the central bank's plans when it comes to balance sheet reduction. It is probable we will hear more about their plans to end quantitative tightening at the upcoming March meeting. For now, the minutes told the markets that short-term interest rates are not likely to rise to the levels the market had feared only a few months ago. At the same time, the Fed's balance sheet will likely remain higher than initially thought for the foreseeable future.
The minutes should be good news for the stock market as a less hawkish approach to monetary policy is supportive of a continuation of the recovery that began in late December. At the same time, it could also be welcome news for commodities. Gold had been telling the market that it does not fear rising interest rates before the release of the minutes of the last meeting. The price of the yellow metal rose to just twenty cents shy of $1350 on the nearby April futures contract on Wednesday before some selling hit the market in the aftermath of the Fed minutes.
Gold has been shining, and gold mining stocks have outperformed both the yellow metal and the price action in the S&P 500 index since mid-September. The VanEck Vectors Gold Miners ETF product (GDX) is a diversified basket of the leading gold producing companies, and it has posted impressive gains over the recent months.
A new and improved stock market in 2019
Stocks took off to the upside following an ugly fourth quarter in 2018. 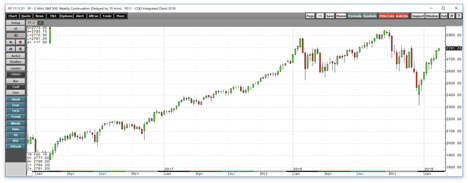
Source: CQG
As the weekly chart of the E-Mini S&P 500 futures contract highlights, after a fall from a peak at 2944.75 in mid-September and early October to a low at 2316.75 in late December, as of late last week, the recovery took the stock index back to the 2790 level. Stocks fell by over 21% and have recovered by over 20% but remained around 150 points off the peak from last September and October.
Stocks have come roaring back because of optimism over a trade deal between the US and China. At the same time, strong earnings continue to reflect corporate tax reform in the US, and the power of share buybacks by companies which cause consistent buying in the stock market on a daily basis. Moreover, a kinder and gentler central bank in 2019 has fueled gains.
The Fed's change of heart provides support
In Q4, stocks fell as concerns that a hawkish Fed that increased short-term interest rates by a full percentage point in 2018 and continued to push longer-term yields higher with its program of balance sheet reduction would weigh on economic growth. However, the price volatility during the final three months of last year caused the central bank to backtrack which lit a bullish fuse under the stock market in late December.
At their most recent meeting, the Fed pivoted from a hawkish approach to monetary policy to a more "patient" and dovish approach. It now appears that the Fed Funds rate will not move as high as the market had feared, and the balance sheet is not likely to contract to as low of a level that the market had anticipated. The shift that will cause rates to moderate around their current levels along the yield curve was welcome news for the stock market. Many participants are now calling the recovery in the stock market, "the Powell Put," which has installed a put option under share prices much like the Fed had done the same under bond prices following the 2008 financial crisis.
Gold has shined in 2019
Gold is an asset that acts as both a currency and a commodity. The yellow metal is a barometer of inflationary pressures, and it tends to have an inverse price relationship with the US dollar. Gold fell to a low in mid-August 2018 at just over $1160 on the nearby futures contract when the dollar index rose to a new high for last year. However, when the dollar moved even higher in mid-December, the price of gold did not fall to a lower low. The precious metal continued to move higher despite strength in the dollar. 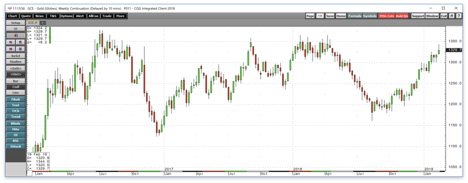
Source: CQG
As the weekly chart illustrates, the price of gold has appreciated from $1161.40 last August to its most recent high last week at $1344 per ounce, a gain of 15.7%. Even though the yellow metal pulled back from the high and closed last week at around the $1330 level, it is still 14.5% higher than its low last summer. Gold has also been working its way higher over the first two months of 2019.
Gold stocks are outperforming the S&P 500 since mid-September
While gold hit its low in mid-August, the gold mining stocks waited one month before they found a bottom. The VanEck Vectors Gold Miners ETF product represents a basket of the leading gold mining equities including an almost 20% exposure to Barrick and Newmont Mining. 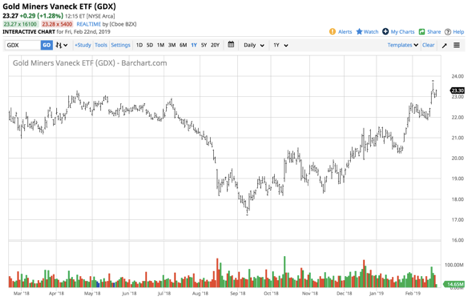
Source: Barchart
As the chart shows, the GDX hit a low at $17.28 on September 11. On that day, the price of gold was at a low at $1204.50 and the E-Mini S&P 500's bottom on that day was at 2880.50. As of February 22, GDX was at $23.27 per share, 34.7% higher. Gold was trading at $1330, 14.5% higher, and the E-Mini was at the 2790 level, about 3% lower. The gold and the GDX outperformed the stock market since September 11, and the GDX provided a leveraged return compared to the yellow metal.
Markets rarely move in a straight line
I cherry-picked the dates when it comes to the performance of gold, the GDX, and the E-Mini S&P 500 futures. However, I wanted to highlight the stellar performance by gold mining stocks since they reached what now looks like a significant bottom. 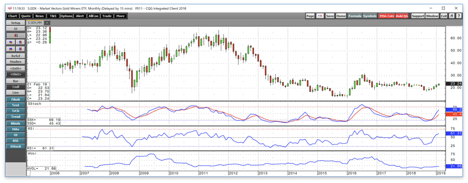
Source: CQG
As the monthly chart of GDX shows, the ETF has posted gains over the past six consecutive months since September. The long-term price momentum and relative strength point to a bullish trend in the gold mining stocks. At over the $23 level at the end of last week, critical technical resistance stands at the September 2017 peak at $25.58 per share. Last week, GDX traded to a high at $23.70 when gold was knocking on the door at the $1350 level.
Gold faces two hurdles on the upside if it can continue to post higher highs above last week's peak. The next level to watch is at $1365.40 which was the 2018 high from last January and April which turned out to be a double top in the gold futures market. Above there, the post-Brexit peak at $1377.50 stands as the technical line in the sand on the upside for gold futures. If gold can climb above those levels, it is likely that GDX will continue to outperform the price action in the yellow metal on a percentage basis.
GDX has also outperformed the stock market since September, as more investors and traders have been going for the gold. GDX has net assets of $10.79 billion and trades an average of over 48 million shares each day making it a highly liquid ETF product. Markets rarely move in a straight line, and the pullback from last Wednesday's highs in both gold and the GDX are likely healthy for the market. Gold has shined in 2019, and that trend looks likely to continue.
The Hecht Commodity Report is one of the most comprehensive commodities reports available today from the #2 ranked author in both commodities and precious metals. My weekly report covers the market movements of 20 different commodities and provides bullish, bearish and neutral calls; directional trading recommendations, and actionable ideas for traders. I just reworked the report to make it very actionable!
Disclosure: I/we have no positions in any stocks mentioned, and no plans to initiate any positions within the next 72 hours. I wrote this article myself, and it expresses my own opinions. I am not receiving compensation for it (other than from Seeking Alpha). I have no business relationship with any company whose stock is mentioned in this article.
Additional disclosure: The author always has positions in commodities markets in futures, options, ETF/ETN products, and commodity equities. These long and short positions tend to change on an intraday basis.
Follow Andrew Hecht and get email alerts